Facebook 2012 Annual Report Download - page 100
Download and view the complete annual report
Please find page 100 of the 2012 Facebook annual report below. You can navigate through the pages in the report by either clicking on the pages listed below, or by using the keyword search tool below to find specific information within the annual report.-
 1
1 -
2
-
3
-
4
-
5
-
6
-
7
-
8
-
9
-
10
-
11
-
12
-
13
-
14
-
15
-
16
-
17
-
18
-
19
-
20
-
21
-
22
-
23
-
24
-
25
-
26
-
27
-
28
-
29
-
30
-
31
-
32
-
33
-
34
-
35
-
36
-
37
-
38
-
39
-
40
-
41
-
42
-
43
-
44
-
45
-
46
-
47
-
48
-
49
-
50
-
51
-
52
-
53
-
54
-
55
-
56
-
57
-
58
-
59
-
60
-
61
-
62
-
63
-
64
-
65
-
66
-
67
-
68
-
69
-
70
-
71
-
72
-
73
-
74
-
75
-
76
-
77
-
78
-
79
-
80
-
81
-
82
-
83
-
84
-
85
-
86
-
87
-
88
-
89
-
 90
90 -
 91
91 -
 92
92 -
 93
93 -
 94
94 -
 95
95 -
 96
96 -
 97
97 -
 98
98 -
 99
99 -
 100
100 -
 101
101 -
 102
102 -
 103
103 -
 104
104 -
 105
105 -
 106
106 -
 107
107 -
 108
108 -
 109
109 -
 110
110 -
111
-
112
-
113
-
114
-
115
-
116
 |
 |

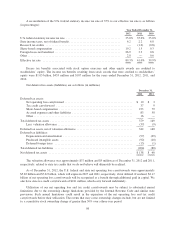
recipient as shares of our common stock. We settled 279 million of Pre-2011 RSUs in 2012 of which 273 million
RSUs were net settled by withholding 123 million shares, which represented the employees’ minimum statutory
obligation for each such employee’s applicable income and other employment taxes and remitted cash totaling of
$2.86 billion to the appropriate tax authorities. The amount remitted to the tax authorities for the employees’ tax
obligation to the tax authorities was reflected as a financing activity within our consolidated statements of cash
flows. These shares withheld by us as a result of the net settlement of Pre-2011 RSUs are no longer considered
issued and outstanding, thereby reducing our shares outstanding used to calculate earnings per share. These
shares are returned to the reserves and are available for future issuance under the 2012 Plan.
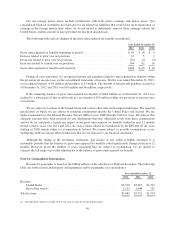
We estimate the fair value of stock options granted using the Black-Scholes-Merton single option valuation
model, which requires inputs such as expected term, expected volatility and risk-free interest rate. Further, the
estimated forfeiture rate of awards also affects the amount of aggregate compensation. These inputs are
subjective and generally require significant analysis and judgment to develop.
We estimate the expected term based upon the historical behavior of our employees for employee grants.
We estimate expected volatility based on a study of publicly traded industry peer companies. The forfeiture rate
is derived primarily from our historical data, and the risk-free interest rate is based on the yield available on U.S.
Treasury zero-coupon issues. Our dividend yield is 0%, since we have not paid, and do not expect to pay,
dividends.
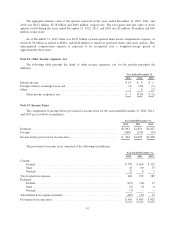
The fair values of employee options granted during 2010 have been estimated as of the date of grant using
the following weighted-average assumptions.
December 31,
2010
Expected term from grant date (in years) .............................................. 7.15
Risk-free interest rate ............................................................. 1.69%
Expected volatility ............................................................... 0.46
Dividend yield .................................................................. —
The weighted-average fair value of employee options granted during the year ended December 31, 2010 was
$5.26 per share. There were no options granted for the years ended December 31, 2012 and 2011.
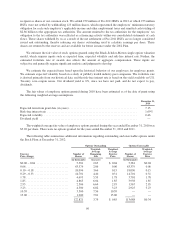
The following table summarizes additional information regarding outstanding and exercisable options under
the Stock Plans at December 31, 2012:
Options Outstanding Options Exercisable
Exercise
Price (Range)
Number of
Shares
Weighted-
Average
Remaining
Life
Weighted-
Average
Exercise
Price
Number of
Shares
Weighted-
Average
Exercise
Price
(in thousands) (in years) (in thousands)
$0.00 – 0.04 ...................... 5,381 2.65 $ 0.04 5,381 $0.04
0.06 ............................. 63,379 2.86 0.06 63,379 0.06
0.10 – 0.18 ....................... 18,096 3.66 0.15 18,096 0.15
0.29 – 0.33 ....................... 14,701 4.40 0.31 14,701 0.31
1.78 ............................. 4,693 5.59 1.78 3,701 1.78
1.85 ............................. 4,865 6.04 1.85 3,938 1.85
2.95 ............................. 2,506 6.64 2.95 1,567 2.95
3.23 ............................. 4,500 6.82 3.23 2,925 3.23
10.39 ............................ 3,500 7.56 10.39 — —
15.00 ............................ 1,200 7.81 15.00 — —
122,821 3.79 $ 0.85 113,688 $0.34
96