Facebook 2012 Annual Report Download - page 59
Download and view the complete annual report
Please find page 59 of the 2012 Facebook annual report below. You can navigate through the pages in the report by either clicking on the pages listed below, or by using the keyword search tool below to find specific information within the annual report.-
 1
1 -
2
-
3
-
4
-
5
-
6
-
7
-
8
-
9
-
10
-
11
-
12
-
13
-
14
-
15
-
16
-
17
-
18
-
19
-
20
-
21
-
22
-
23
-
24
-
25
-
26
-
27
-
28
-
29
-
30
-
31
-
32
-
33
-
34
-
35
-
36
-
37
-
38
-
39
-
40
-
41
-
42
-
43
-
44
-
45
-
46
-
47
-
48
-
 49
49 -
 50
50 -
 51
51 -
 52
52 -
 53
53 -
 54
54 -
 55
55 -
 56
56 -
 57
57 -
 58
58 -
 59
59 -
 60
60 -
 61
61 -
 62
62 -
 63
63 -
 64
64 -
 65
65 -
 66
66 -
 67
67 -
 68
68 -
 69
69 -
70
-
71
-
72
-
73
-
74
-
75
-
76
-
77
-
78
-
79
-
80
-
81
-
82
-
83
-
84
-
85
-
86
-
87
-
88
-
89
-
90
-
91
-
92
-
93
-
94
-
95
-
96
-
97
-
98
-
99
-
100
-
101
-
102
-
103
-
104
-
105
-
106
-
107
-
108
-
109
-
110
-
111
-
112
-
113
-
114
-
115
-
116
 |
 |

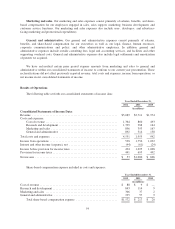
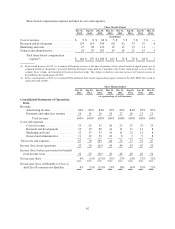
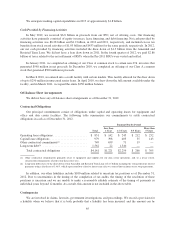
The following table set forth our consolidated statements of income data (as a percentage of revenue):
Year Ended December 31,
2012 2011 2010
Consolidated Statements of Income Data:
Revenue ........................................................ 100% 100% 100%
Costs and expenses:
Cost of revenue .............................................. 27 23 25
Research and development ..................................... 27 10 7
Marketing and sales .......................................... 18 11 8
General and administrative ..................................... 18 8 7
Total costs and expenses ........................................... 89 53 48
Income from operations ........................................... 11 47 52
Interest and other income (expense), net .............................. (1) (2) (1)
Income before provision for income taxes ............................. 10 46 51
Provision for income taxes ......................................... 9 19 20
Net income ..................................................... 1% 27% 31%
Share-based compensation expense included in costs and expenses (as a percentage of revenue):
Year Ended December 31,
2012 2011 2010
Cost of revenue .................................................. 2% — —
Research and development ......................................... 17 3 —
Marketing and sales .............................................. 6 1 —
General and administrative ......................................... 7 2 —
Total share-based compensation expense .......................... 31% 6% 1%
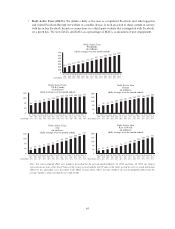
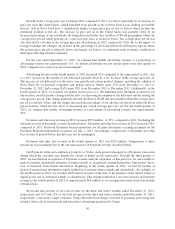
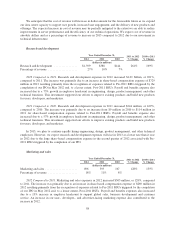
Revenue
Year Ended December 31, 2011 to 2012
% Change
2010 to 2011
% Change2012 2011 2010
(in millions)
Advertising ............................. $4,279 $3,154 $1,868 36% 69%
Payments and other fees ................... 810 557 106 45% 425%
Total revenue ....................... $5,089 $3,711 $1,974 37% 88%
2012 Compared to 2011. Revenue in 2012 increased $1.38 billion, or 37% compared to 2011. The increase
was due primarily to a 36% increase in advertising revenue during 2012 as compared to 2011.
Advertising revenue grew due to a 32% increase in the number of ads delivered during 2012 and to a 3%
increase in the average price per ad. The increase in ads delivered was driven primarily by user growth. MAUs
grew 25% from December 31, 2011 to December 31, 2012 and average DAUs grew 28% from December 2011 to
December 2012. Various product changes and changes in user engagement generally offset in their impact on the
average number of ads per user. For example, the shift to greater mobile use generally reduced ads per user,
while the introduction of ads in News Feed increased the number of ads per user. The rate of change in number
of ads delivered also differs by geography, driven by factors such as mobile penetration. For example, Europe
and Rest of World increased at a faster rate than the United States and Asia.
55