Facebook 2012 Annual Report Download - page 63
Download and view the complete annual report
Please find page 63 of the 2012 Facebook annual report below. You can navigate through the pages in the report by either clicking on the pages listed below, or by using the keyword search tool below to find specific information within the annual report.-
 1
1 -
2
-
3
-
4
-
5
-
6
-
7
-
8
-
9
-
10
-
11
-
12
-
13
-
14
-
15
-
16
-
17
-
18
-
19
-
20
-
21
-
22
-
23
-
24
-
25
-
26
-
27
-
28
-
29
-
30
-
31
-
32
-
33
-
34
-
35
-
36
-
37
-
38
-
39
-
40
-
41
-
42
-
43
-
44
-
45
-
46
-
47
-
48
-
49
-
50
-
51
-
52
-
 53
53 -
 54
54 -
 55
55 -
 56
56 -
 57
57 -
 58
58 -
 59
59 -
 60
60 -
 61
61 -
 62
62 -
 63
63 -
 64
64 -
 65
65 -
 66
66 -
 67
67 -
 68
68 -
 69
69 -
 70
70 -
 71
71 -
 72
72 -
 73
73 -
74
-
75
-
76
-
77
-
78
-
79
-
80
-
81
-
82
-
83
-
84
-
85
-
86
-
87
-
88
-
89
-
90
-
91
-
92
-
93
-
94
-
95
-
96
-
97
-
98
-
99
-
100
-
101
-
102
-
103
-
104
-
105
-
106
-
107
-
108
-
109
-
110
-
111
-
112
-
113
-
114
-
115
-
116
 |
 |

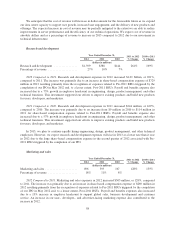
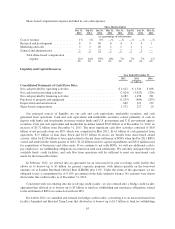
2011 Compared to 2010. Marketing and sales expenses in 2011 increased $226 million, or 135%, compared
to 2010. The increase was primarily due to an increase in payroll and benefits expenses resulting from a 45%
increase in employee headcount to support global sales, business development, and customer service, and, to a
lesser extent, an increase in our user-, developer-, and advertiser-facing marketing. Additionally, share-based
compensation expense increased from $2 million in 2010 to $37 million in 2011 due to recognition of expense
related to Post-2011 RSUs.
In 2013, we plan to add sales, business development and customer service employees, and increase our
investment in user-, developer-, and marketer-facing marketing. However, we expect marketing and sales
expenses will rise in 2013 at a lower rate than it rose in 2012 due to the large share-based compensation expense
in the second quarter of 2012 associated with Pre-2011 RSUs triggered by the completion of our IPO.
General and administrative
Year Ended December 31, 2011 to 2012
% Change
2010 to 2011
% Change2012 2011 2010
(dollars in millions)
General and administrative ................ $892 $314 $138 184% 128%
Percentage of revenue .................... 18% 8% 7%
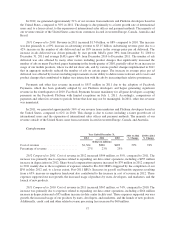
2012 Compared to 2011. General and administrative expenses in 2012 increased $578 million, or 184%,
compared to 2011. The increase was primarily due to an increase in share-based compensation expense of $278
million resulting from recognition of expense related to Pre-2011 RSUs and, to a lesser extent, Post-2011 RSUs.
The increase was also due to growth in legal fees and settlement costs, amortization of acquired patents and other
professional service fees. Payroll and benefits expenses also increased for 2012 due to a 38% increase in
employee headcount in corporate communications and policy, human resources, legal, finance, and other
functions.
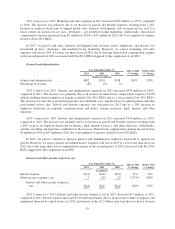
2011 Compared to 2010. General and administrative expenses in 2011 increased $176 million, or 128%,
compared to 2010. The increase was primarily due to an increase in payroll and benefits expenses resulting from
a 60% increase in employee headcount in finance, legal, human resources, and other functions. Additionally,
outside consulting and legal fees contributed to the increase. Share-based compensation expense increased from
$9 million in 2010 to $57 million in 2011 due to recognition of expense related to Post-2011 RSUs.
In 2013, we plan to continue to increase general and administrative employee headcount to support our
growth. However, we expect general and administrative expenses will rise in 2013 at a lower rate than it rose in
2012 due to the large share-based compensation expense in the second quarter of 2012 associated with Pre-2011
RSUs triggered by the completion of our IPO.
Interest and other income (expense), net
Year Ended December 31, 2011 to 2012
% Change
2010 to 2011
% Change2012 2011 2010
(in millions)
Interest expense ......................... $(51) $(42) $(22) 21% 91%
Other income (expense), net ............... 7 (19) (2) (137)% 850%
Interest and other income (expense),
net.............................. $(44) $(61) $(24) (28)% 154%
2012 Compared to 2011. Interest and other income (expense), net in 2012 decreased $17 million, or 28%,
compared to 2011. Interest expense increased by $9 million primarily due to an increased volume of property and
equipment financed by capital leases for 2012 and interest on the $1.5 billion term loan that was drawn down in
59