Facebook 2012 Annual Report Download - page 91
Download and view the complete annual report
Please find page 91 of the 2012 Facebook annual report below. You can navigate through the pages in the report by either clicking on the pages listed below, or by using the keyword search tool below to find specific information within the annual report.-
 1
1 -
2
-
3
-
4
-
5
-
6
-
7
-
8
-
9
-
10
-
11
-
12
-
13
-
14
-
15
-
16
-
17
-
18
-
19
-
20
-
21
-
22
-
23
-
24
-
25
-
26
-
27
-
28
-
29
-
30
-
31
-
32
-
33
-
34
-
35
-
36
-
37
-
38
-
39
-
40
-
41
-
42
-
43
-
44
-
45
-
46
-
47
-
48
-
49
-
50
-
51
-
52
-
53
-
54
-
55
-
56
-
57
-
58
-
59
-
60
-
61
-
62
-
63
-
64
-
65
-
66
-
67
-
68
-
69
-
70
-
71
-
72
-
73
-
74
-
75
-
76
-
77
-
78
-
79
-
80
-
 81
81 -
 82
82 -
 83
83 -
 84
84 -
 85
85 -
 86
86 -
 87
87 -
 88
88 -
 89
89 -
 90
90 -
 91
91 -
 92
92 -
 93
93 -
 94
94 -
 95
95 -
 96
96 -
 97
97 -
 98
98 -
 99
99 -
 100
100 -
 101
101 -
102
-
103
-
104
-
105
-
106
-
107
-
108
-
109
-
110
-
111
-
112
-
113
-
114
-
115
-
116
 |
 |

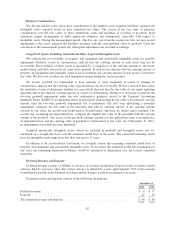
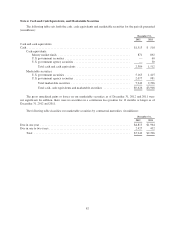
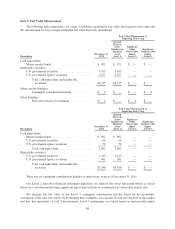
Note 4. Cash and Cash Equivalents, and Marketable Securities
The following table sets forth the cash, cash equivalents and marketable securities for the periods presented
(in millions):
December 31,
2012 2011
Cash and cash equivalents:
Cash ...................................................................... $1,513 $ 510
Cash equivalents:
Money market funds ................................................. 871 892
U.S. government securities ............................................ — 60
U.S. government agency securities ...................................... — 50
Total cash and cash equivalents .................................... 2,384 1,512
Marketable securities:
U.S. government securities ............................................ 5,165 1,415
U.S. government agency securities ...................................... 2,077 981
Total marketable securities ........................................ 7,242 2,396
Total cash, cash equivalents and marketable securities .................. $9,626 $3,908
The gross unrealized gains or losses on our marketable securities as of December 31, 2012 and 2011 were
not significant. In addition, there were no securities in a continuous loss position for 12 months or longer as of
December 31, 2012 and 2011.
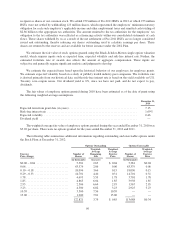
The following table classifies our marketable securities by contractual maturities: (in millions):
December 31,
2012 2011
Due in one year ............................................................. $4,815 $1,964
Due in one to two years ....................................................... 2,427 432
Total ................................................................. $7,242 $2,396
87