Facebook 2012 Annual Report Download - page 65
Download and view the complete annual report
Please find page 65 of the 2012 Facebook annual report below. You can navigate through the pages in the report by either clicking on the pages listed below, or by using the keyword search tool below to find specific information within the annual report.-
 1
1 -
2
-
3
-
4
-
5
-
6
-
7
-
8
-
9
-
10
-
11
-
12
-
13
-
14
-
15
-
16
-
17
-
18
-
19
-
20
-
21
-
22
-
23
-
24
-
25
-
26
-
27
-
28
-
29
-
30
-
31
-
32
-
33
-
34
-
35
-
36
-
37
-
38
-
39
-
40
-
41
-
42
-
43
-
44
-
45
-
46
-
47
-
48
-
49
-
50
-
51
-
52
-
53
-
54
-
 55
55 -
 56
56 -
 57
57 -
 58
58 -
 59
59 -
 60
60 -
 61
61 -
 62
62 -
 63
63 -
 64
64 -
 65
65 -
 66
66 -
 67
67 -
 68
68 -
 69
69 -
 70
70 -
 71
71 -
 72
72 -
 73
73 -
 74
74 -
 75
75 -
76
-
77
-
78
-
79
-
80
-
81
-
82
-
83
-
84
-
85
-
86
-
87
-
88
-
89
-
90
-
91
-
92
-
93
-
94
-
95
-
96
-
97
-
98
-
99
-
100
-
101
-
102
-
103
-
104
-
105
-
106
-
107
-
108
-
109
-
110
-
111
-
112
-
113
-
114
-
115
-
116
 |
 |

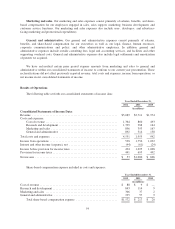
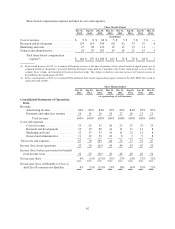
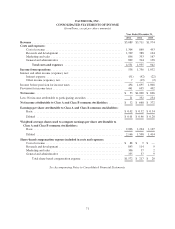
Quarterly Results of Operations Data
The following tables set forth our unaudited quarterly consolidated statements of operations data in dollars
and as a percentage of total revenue for each of the eight quarters in the period ended December 31, 2012. We
have prepared the quarterly consolidated statements of operations data on a basis consistent with the audited
consolidated financial statements included in Part II, Item 8, “Financial Statements and Supplementary Data” in
this Annual Report on Form 10-K. In the opinion of management, the financial information reflects all
adjustments, consisting only of normal recurring adjustments, which we consider necessary for a fair presentation
of this data. This information should be read in conjunction with the audited consolidated financial statements
and related notes included in Part II, Item 8, “Financial Statements and Supplementary Data” in this Annual
Report on Form 10-K. The results of historical periods are not necessarily indicative of the results of operations
for any future period.
Three Months Ended
Dec 31,
2012
Sep 30,
2012
Jun 30,
2012
Mar 31,
2012
Dec 31,
2011
Sep 30,
2011
Jun 30,
2011
Mar 31,
2011
(in millions)
Consolidated Statements of
Operations Data:
Revenue:
Advertising revenue ...... $1,329 $1,086 $ 992 $ 872 $ 943 $ 798 $ 776 $ 637
Payments and other fees
revenue(1) ............. 256 176 192 186 188 156 119 94
Total revenue ........ 1,585 1,262 1,184 1,058 1,131 954 895 731
Costs and expenses:
Cost of revenue .......... 398 322 367 277 247 236 210 167
Research and
development .......... 297 244 705 153 124 108 99 57
Marketing and sales ....... 193 168 392 143 120 114 96 62
General and
administrative ......... 174 151 463 104 92 82 83 57
Total costs and expenses ........... 1,062 885 1,927 677 583 540 488 343
Income (loss) from operations ...... 523 377 (743) 381 548 414 407 388
Income (loss) before (provision for)
benefit from income taxes ........ 505 372 (765) 382 520 379 399 398
Net income (loss) ................ $ 64 $ (59) $ (157) $ 205 $ 302 $ 227 $ 240 $ 233
Net income (loss) attributable to
Class A and Class B common
stockholders ................... $ 64 $ (59) $ (157) $ 137 $ 205 $ 150 $ 159 $ 153
Earnings (loss) per share attributable
to Class A and Class B common
stockholders:
Basic ...................... $ 0.03 $ (0.02) $ (0.08) $ 0.10 $ 0.15 $ 0.11 $ 0.12 $ 0.12
Diluted ..................... $ 0.03 $ (0.02) $ (0.08) $ 0.09 $ 0.14 $ 0.10 $ 0.11 $ 0.11
61