Facebook 2012 Annual Report Download - page 49
Download and view the complete annual report
Please find page 49 of the 2012 Facebook annual report below. You can navigate through the pages in the report by either clicking on the pages listed below, or by using the keyword search tool below to find specific information within the annual report.-
 1
1 -
2
-
3
-
4
-
5
-
6
-
7
-
8
-
9
-
10
-
11
-
12
-
13
-
14
-
15
-
16
-
17
-
18
-
19
-
20
-
21
-
22
-
23
-
24
-
25
-
26
-
27
-
28
-
29
-
30
-
31
-
32
-
33
-
34
-
35
-
36
-
37
-
38
-
 39
39 -
 40
40 -
 41
41 -
 42
42 -
 43
43 -
 44
44 -
 45
45 -
 46
46 -
 47
47 -
 48
48 -
 49
49 -
 50
50 -
 51
51 -
 52
52 -
 53
53 -
 54
54 -
 55
55 -
 56
56 -
 57
57 -
 58
58 -
 59
59 -
60
-
61
-
62
-
63
-
64
-
65
-
66
-
67
-
68
-
69
-
70
-
71
-
72
-
73
-
74
-
75
-
76
-
77
-
78
-
79
-
80
-
81
-
82
-
83
-
84
-
85
-
86
-
87
-
88
-
89
-
90
-
91
-
92
-
93
-
94
-
95
-
96
-
97
-
98
-
99
-
100
-
101
-
102
-
103
-
104
-
105
-
106
-
107
-
108
-
109
-
110
-
111
-
112
-
113
-
114
-
115
-
116
 |
 |

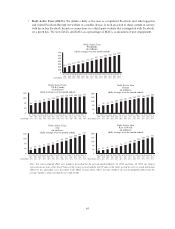
•Daily Active Users (DAUs). We define a daily active user as a registered Facebook user who logged in
and visited Facebook through our website or a mobile device, or took an action to share content or activity
with his or her Facebook friends or connections via a third-party website that is integrated with Facebook,
on a given day. We view DAUs, and DAUs as a percentage of MAUs, as measures of user engagement.
Daily Active Users
US & Canada
(in millions)
(daily average over the month ended)
0
40
80
120
160
64
82 85 92 99 105 117 124 126 129 130 132 135
Dec 31
2009
Mar 31
2010
Jun 30
2010
Sep 30
2010
Dec 31
2010
Mar 31
2011
Jun 30
2011
Sep 30
2011
Dec 31
2011
Mar 31
2012
Jun 30
2012
Sep 30
2012
Dec 31
2012
DAU/MAU: 57% 63% 62% 64% 64% 69% 71% 71% 70% 70% 70% 70%64%
Daily Active User
Worldwide
(in millions)
(daily average over the month ended)
0
100
200
300
400
500
600
700
DAU/MAU:
185 234 257 293 327 372 417 457 483 526 552 584 618
Dec 31
2009
Mar 31
2010
Jun 30
2010
Sep 30
2010
Dec 31
2010
Mar 31
2011
Jun 30
2011
Sep 30
2011
Dec 31
2011
Mar 31
2012
Jun 30
2012
Sep 30
2012
Dec 31
2012
51% 54% 53% 54% 55% 56% 57% 57% 58% 58% 58% 59%53%
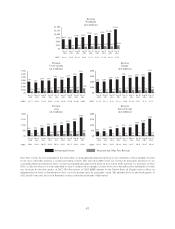
Daily Active User
Europe
(in millions)
(daily average over the month ended)
0
40
80
120
160
200
63 79 85 94 107 120 127 135 143 152 154 160 169
Dec 31
2009
Mar 31
2010
Jun 30
2010
Sep 30
2010
Dec 31
2010
Mar 31
2011
Jun 30
2011
Sep 30
2011
Dec 31
2011
Mar 31
2012
Jun 30
2012
Sep 30
2012
Dec 31
2012
DAU/MAU: 53% 57% 56% 58% 60% 60% 61% 63% 64% 63% 63% 65%56%
Daily Active User
Rest of World
(in millions)
(daily average over the month ended)
29 35 42 54 58 74 87 100 109 126 139 152 161
0
40
80
120
160
200
Dec 31
2009
Mar 31
2010
Jun 30
2010
Sep 30
2010
Dec 31
2010
Mar 31
2011
Jun 30
2011
Sep 30
2011
Dec 31
2011
Mar 31
2012
Jun 30
2012
Sep 30
2012
Dec 31
2012
DAU/MAU: 42% 42% 43% 44% 46% 47% 48% 48% 51% 52% 53% 53%43%
Daily Active Users
Asia
(in millions)
(daily average over the month ended)
0
40
80
120
160 141 153
29 39 45 54 64 72 85 98 105 119 129
Dec 31
2009
Mar 31
2010
Jun 30
2010
Sep 30
2010
Dec 31
2010
Mar 31
2011
Jun 30
2011
Sep 30
2011
Dec 31
2011
Mar 31
2012
Jun 30
2012
Sep 30
2012
Dec 31
2012
DAU/MAU:47% 48% 47% 46% 47% 49% 50% 49% 51% 51% 51% 51%47%
Note: For non-worldwide DAU user numbers presented for the periods marked March 31, 2012 and June 30, 2012, the figures
represent an average of the first 25 days of the former period and the last 27 days of the latter period in order to avoid using data
subject to the algorithm error described in the MAU section above. These average numbers do not meaningfully differ from the
average numbers when calculated over a full month.
45