Facebook 2012 Annual Report Download - page 48
Download and view the complete annual report
Please find page 48 of the 2012 Facebook annual report below. You can navigate through the pages in the report by either clicking on the pages listed below, or by using the keyword search tool below to find specific information within the annual report.-
 1
1 -
2
-
3
-
4
-
5
-
6
-
7
-
8
-
9
-
10
-
11
-
12
-
13
-
14
-
15
-
16
-
17
-
18
-
19
-
20
-
21
-
22
-
23
-
24
-
25
-
26
-
27
-
28
-
29
-
30
-
31
-
32
-
33
-
34
-
35
-
36
-
37
-
 38
38 -
 39
39 -
 40
40 -
 41
41 -
 42
42 -
 43
43 -
 44
44 -
 45
45 -
 46
46 -
 47
47 -
 48
48 -
 49
49 -
 50
50 -
 51
51 -
 52
52 -
 53
53 -
 54
54 -
 55
55 -
 56
56 -
 57
57 -
 58
58 -
59
-
60
-
61
-
62
-
63
-
64
-
65
-
66
-
67
-
68
-
69
-
70
-
71
-
72
-
73
-
74
-
75
-
76
-
77
-
78
-
79
-
80
-
81
-
82
-
83
-
84
-
85
-
86
-
87
-
88
-
89
-
90
-
91
-
92
-
93
-
94
-
95
-
96
-
97
-
98
-
99
-
100
-
101
-
102
-
103
-
104
-
105
-
106
-
107
-
108
-
109
-
110
-
111
-
112
-
113
-
114
-
115
-
116
 |
 |
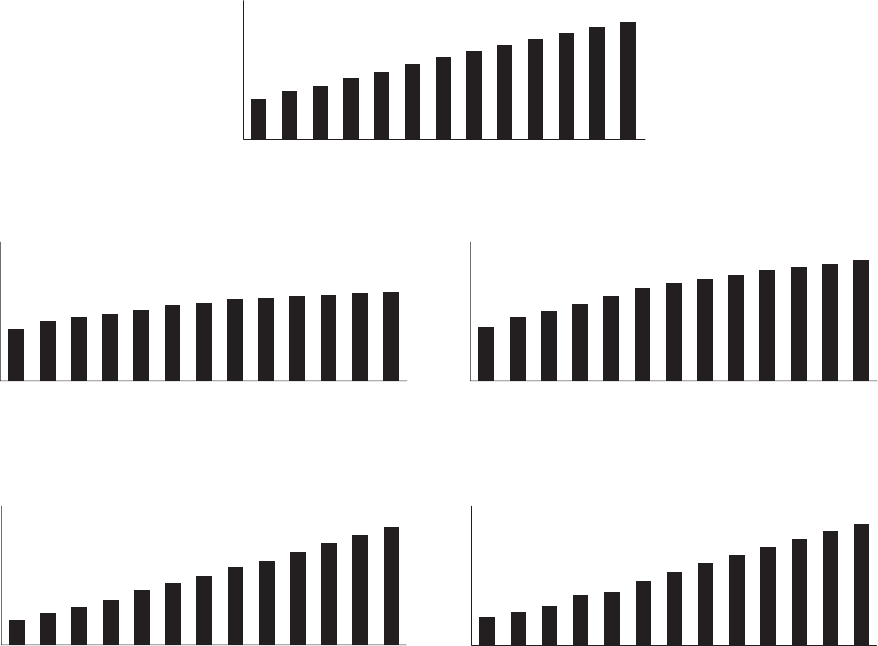
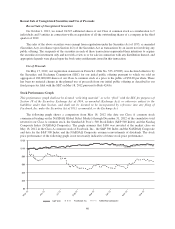
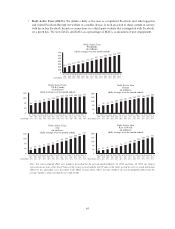
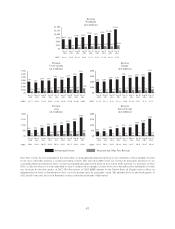
Trends in Our User Metrics
The numbers of MAUs, DAUs, and mobile MAUs discussed below, as well as average revenue per user (ARPU),
do not include Instagram users unless such users would otherwise qualify as MAUs, DAUs and/or mobile MAUs
based on activity that is shared back to Facebook.
•Monthly Active Users (MAUs). We define a monthly active user as a registered Facebook user who
logged in and visited Facebook through our website or a mobile device, or took an action to share
content or activity with his or her Facebook friends or connections via a third-party website that is
integrated with Facebook, in the last 30 days as of the date of measurement. MAUs are a measure of
the size of our global active user community, which has grown substantially in the past several years.
Monthly Active Users
Worldwide
(in millions)
1,250
1,000
250
500
750
0
Dec 31
2009
Mar 31
2010
Jun 30
2010
Sep 30
2010
Dec 31
2010
Mar 31
2011
Jun 30
2011
Sep 30
2011
Dec 31
2011
Mar 31
2012
Jun 30
2012
Sep 30
2012
Dec 31
2012
360 431 482 550 608 680 739 800 845 901 955 1,0071,056
Monthly Active Users
US & Canada
(in millions)
150
200
300
250
0
50
100
Dec 31
2009
Mar 31
2010
Jun 30
2010
Sep 30
2010
Dec 31
2010
Mar 31
2011
Jun 30
2011
Sep 30
2011
Dec 31
2011
Mar 31
2012
Jun 30
2012
Sep 30
2012
Dec 31
2012
112 130 137 144 154 163 169 176 179 183 186 189 193
Monthly Active Users
Europe
(in millions)
200
300
250
0
50
100
150
Dec 31
2009
Mar 31
2010
Jun 30
2010
Sep 30
2010
Dec 31
2010
Mar 31
2011
Jun 30
2011
Sep 30
2011
Dec 31
2011
Mar 31
2012
Jun 30
2012
Sep 30
2012
Dec 31
2012
117 138 151 167 183 201 212 221 229 239 246 253 261
Monthly Active Users
Asia
(in millions)
350
300
100
150
250
200
0
50
Dec 31
2009
Mar 31
2010
Jun 30
2010
Sep 30
2010
Dec 31
2010
Mar 31
2011
Jun 30
2011
Sep 30
2011
Dec 31
2011
Mar 31
2012
Jun 30
2012
Sep 30
2012
Dec 31
2012
62 81 96 113 138 156 174 196 212 234 255 277 298
Monthly Active Users
Rest of World
(in millions)
350
300
100
150
250
200
0
50
Dec 31
2009
Mar 31
2010
Jun 30
2010
Sep 30
2010
Dec 31
2010
Mar 31
2011
Jun 30
2011
Sep 30
2011
Dec 31
2011
Mar 31
2012
Jun 30
2012
Sep 30
2012
Dec 31
2012
69 83 98 126 133 161 183 207 225 245 268 288 304
Note: For purposes of reporting MAUs, DAUs, and ARPU by geographic region, Europe includes all users in Russia and Turkey, Asia
includes all users in Australia and New Zealand, and Rest of World includes Africa, Latin America, and the Middle East. In June 2012, we
discovered an error in the algorithm we used to estimate the geographic location of our users that affected our attribution of certain user
locations for the first quarter of 2012. While this issue did not affect our overall worldwide MAU number, it did affect our attribution of
users to different geographic regions. The first quarter of 2012 user metrics as pictured in the charts above reflect the reclassification to
more correctly attribute users by geographic region.
As of December 31, 2012, we had 1.06 billion MAUs, an increase of 25% from December 31, 2011. Users
in Brazil, India and Indonesia represented key sources of growth in fiscal 2012 relative to the prior year. We
had 67 million MAUs in Brazil as of December 31, 2012, an increase of 81% compared to the same period
in 2011; we had 71 million MAUs in India as of December 31, 2012, an increase of 54% compared to the
same period in 2011; and we had 60 million MAUs in Indonesia as of December 31, 2012, an increase of
25% compared to the same period in 2011. Additionally, we had 174 million MAUs in the United States as
of December 31, 2012, an increase of 8% compared to the same period in 2011.
44