Facebook 2012 Annual Report Download - page 74
Download and view the complete annual report
Please find page 74 of the 2012 Facebook annual report below. You can navigate through the pages in the report by either clicking on the pages listed below, or by using the keyword search tool below to find specific information within the annual report.-
 1
1 -
2
-
3
-
4
-
5
-
6
-
7
-
8
-
9
-
10
-
11
-
12
-
13
-
14
-
15
-
16
-
17
-
18
-
19
-
20
-
21
-
22
-
23
-
24
-
25
-
26
-
27
-
28
-
29
-
30
-
31
-
32
-
33
-
34
-
35
-
36
-
37
-
38
-
39
-
40
-
41
-
42
-
43
-
44
-
45
-
46
-
47
-
48
-
49
-
50
-
51
-
52
-
53
-
54
-
55
-
56
-
57
-
58
-
59
-
60
-
61
-
62
-
63
-
 64
64 -
 65
65 -
 66
66 -
 67
67 -
 68
68 -
 69
69 -
 70
70 -
 71
71 -
 72
72 -
 73
73 -
 74
74 -
 75
75 -
 76
76 -
 77
77 -
 78
78 -
 79
79 -
 80
80 -
 81
81 -
 82
82 -
 83
83 -
 84
84 -
85
-
86
-
87
-
88
-
89
-
90
-
91
-
92
-
93
-
94
-
95
-
96
-
97
-
98
-
99
-
100
-
101
-
102
-
103
-
104
-
105
-
106
-
107
-
108
-
109
-
110
-
111
-
112
-
113
-
114
-
115
-
116
 |
 |

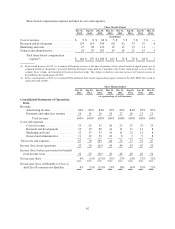
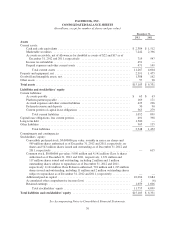
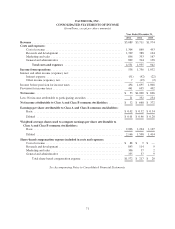
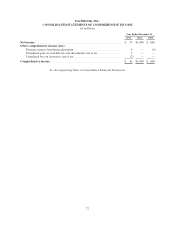
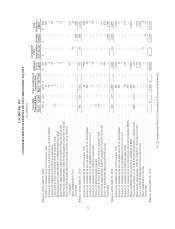
FACEBOOK, INC.
CONSOLIDATED BALANCE SHEETS
(In millions, except for number of shares and par value)
December 31,
2012 2011
Assets
Current assets:
Cash and cash equivalents ................................................. $ 2,384 $ 1,512
Marketable securities .................................................... 7,242 2,396
Accounts receivable, net of allowances for doubtful accounts of $22 and $17 as of
December 31, 2012 and 2011, respectively ................................. 719 547
Income tax refundable .................................................... 451 —
Prepaid expenses and other current assets .................................... 471 149
Total current assets .................................................. 11,267 4,604
Property and equipment, net ................................................... 2,391 1,475
Goodwill and intangible assets, net .............................................. 1,388 162
Other assets ................................................................ 57 90
Total assets ................................................................ $15,103 $ 6,331
Liabilities and stockholders’ equity
Current liabilities:
Accounts payable ....................................................... $ 65 $ 63
Platform partners payable ................................................. 169 171
Accrued expenses and other current liabilities ................................. 423 296
Deferred revenue and deposits ............................................. 30 90
Current portion of capital lease obligations ................................... 365 279
Total current liabilities ............................................... 1,052 899
Capital lease obligations, less current portion ...................................... 491 398
Long-term debt ............................................................. 1,500 —
Other liabilities ............................................................. 305 135
Total liabilities ..................................................... 3,348 1,432
Commitments and contingencies
Stockholders’ equity:
Convertible preferred stock, $0.000006 par value, issuable in series; no shares and
569 million shares authorized as of December 31, 2012 and 2011, respectively, no
shares and 543 million shares issued and outstanding as of December 31, 2012 and
2011, respectively ..................................................... — 615
Common stock, $0.000006 par value; 5,000 million and 4,141 million Class A shares
authorized as of December 31, 2012 and 2011, respectively, 1,671 million and
117 million shares issued and outstanding, including 2 million and 1 million
outstanding shares subject to repurchase as of December 31, 2012 and 2011,
respectively; 4,141 million Class B shares authorized, 701 million and 1,213 million
shares issued and outstanding, including 11 million and 2 million outstanding shares
subject to repurchase as of December 31, 2012 and 2011, respectively ............ — —
Additional paid-in capital ................................................. 10,094 2,684
Accumulated other comprehensive income (loss) .............................. 2 (6)
Retained earnings ....................................................... 1,659 1,606
Total stockholders’ equity ............................................. 11,755 4,899
Total liabilities and stockholders’ equity ....................................... $15,103 $ 6,331
See Accompanying Notes to Consolidated Financial Statements.
70