Facebook 2012 Annual Report Download - page 83
Download and view the complete annual report
Please find page 83 of the 2012 Facebook annual report below. You can navigate through the pages in the report by either clicking on the pages listed below, or by using the keyword search tool below to find specific information within the annual report.-
 1
1 -
2
-
3
-
4
-
5
-
6
-
7
-
8
-
9
-
10
-
11
-
12
-
13
-
14
-
15
-
16
-
17
-
18
-
19
-
20
-
21
-
22
-
23
-
24
-
25
-
26
-
27
-
28
-
29
-
30
-
31
-
32
-
33
-
34
-
35
-
36
-
37
-
38
-
39
-
40
-
41
-
42
-
43
-
44
-
45
-
46
-
47
-
48
-
49
-
50
-
51
-
52
-
53
-
54
-
55
-
56
-
57
-
58
-
59
-
60
-
61
-
62
-
63
-
64
-
65
-
66
-
67
-
68
-
69
-
70
-
71
-
72
-
 73
73 -
 74
74 -
 75
75 -
 76
76 -
 77
77 -
 78
78 -
 79
79 -
 80
80 -
 81
81 -
 82
82 -
 83
83 -
 84
84 -
 85
85 -
 86
86 -
 87
87 -
 88
88 -
 89
89 -
 90
90 -
 91
91 -
 92
92 -
 93
93 -
94
-
95
-
96
-
97
-
98
-
99
-
100
-
101
-
102
-
103
-
104
-
105
-
106
-
107
-
108
-
109
-
110
-
111
-
112
-
113
-
114
-
115
-
116
 |
 |
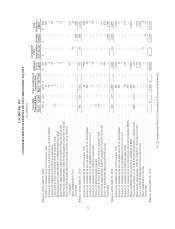
tax liability was less than the deferred tax assets that were recorded. These net amounts were recorded as an
adjustment to stockholders’ equity in each period, as an increase to cash flows from operating activities, and
were not recognized in our consolidated statements of income.
The tax benefits realized from share-based award activity of $1.03 billion relate to both the reduction of
current year income tax liabilities and the expected refund of $451 million from income tax loss carrybacks to
2010 and 2011.
In addition, we reported excess tax benefits that decreased our cash flows from operating activities and
increased our cash flows from financing activities for the years ended December 31, 2012, 2011, and 2010, by
$1.03 billion, $433 million, $115 million, respectively. The amounts of these excess tax benefits reflect the total
of the individual transactions in which the reduction to our income tax liability was greater than the deferred tax
assets that were recorded, but were not reduced by any of the individual transactions in which the reduction to
our income tax liability was less than the deferred tax assets that were recorded.
Income Taxes
We recognize income taxes under the asset and liability method. We recognize deferred income tax assets
and liabilities for the expected future consequences of temporary differences between the financial reporting and
tax bases of assets and liabilities. These differences are measured using the enacted statutory tax rates that are
expected to apply to taxable income for the years in which differences are expected to reverse. We recognize the
effect on deferred income taxes of a change in tax rates in income in the period that includes the enactment date.
We record a valuation allowance to reduce our deferred tax assets to the net amount that we believe is more
likely than not to be realized. We consider all available evidence, both positive and negative, including historical
levels of income, expectations and risks associated with estimates of future taxable income and ongoing tax
planning strategies in assessing the need for a valuation allowance.
We recognize tax benefits from uncertain tax positions only if we believe that it is more likely than not that
the tax position will be sustained on examination by the taxing authorities based on the technical merits of the
position. We make adjustments to these reserves when facts and circumstances change, such as the closing of a
tax audit or the refinement of an estimate. The provision for income taxes includes the effects of any reserves that
are considered appropriate, as well as the related net interest and penalties.
Advertising Expense
Advertising costs are expensed when incurred and are included in marketing and sales expenses in the
accompanying consolidated statements of income. We incurred advertising expenses of $67 million, $28 million,
and $8 million for the years ended December 31, 2012, 2011, and 2010, respectively.
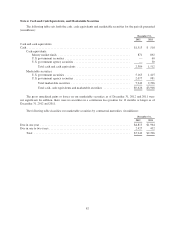
Cash and Cash Equivalents, and Marketable Securities
Cash and cash equivalents primarily consist of cash on deposit with banks and investments in money market
funds, and U.S. government and U.S. government agency securities with maturities of 90 days or less from the
date of purchase.
We hold investments in marketable securities, consisting of U.S. government and U.S. government agency
securities. We classify our marketable securities as available-for-sale investments in our current assets because
they represent investments of cash available for current operations. Our available-for-sale investments are carried
at estimated fair value with any unrealized gains and losses, net of taxes, included in accumulated other
comprehensive income/(loss) in stockholders’ equity. Unrealized losses are charged against other income
(expense), net when a decline in fair value is determined to be other-than-temporary. We have not recorded any
79