Facebook 2012 Annual Report Download - page 68
Download and view the complete annual report
Please find page 68 of the 2012 Facebook annual report below. You can navigate through the pages in the report by either clicking on the pages listed below, or by using the keyword search tool below to find specific information within the annual report.-
 1
1 -
2
-
3
-
4
-
5
-
6
-
7
-
8
-
9
-
10
-
11
-
12
-
13
-
14
-
15
-
16
-
17
-
18
-
19
-
20
-
21
-
22
-
23
-
24
-
25
-
26
-
27
-
28
-
29
-
30
-
31
-
32
-
33
-
34
-
35
-
36
-
37
-
38
-
39
-
40
-
41
-
42
-
43
-
44
-
45
-
46
-
47
-
48
-
49
-
50
-
51
-
52
-
53
-
54
-
55
-
56
-
57
-
 58
58 -
 59
59 -
 60
60 -
 61
61 -
 62
62 -
 63
63 -
 64
64 -
 65
65 -
 66
66 -
 67
67 -
 68
68 -
 69
69 -
 70
70 -
 71
71 -
 72
72 -
 73
73 -
 74
74 -
 75
75 -
 76
76 -
 77
77 -
 78
78 -
79
-
80
-
81
-
82
-
83
-
84
-
85
-
86
-
87
-
88
-
89
-
90
-
91
-
92
-
93
-
94
-
95
-
96
-
97
-
98
-
99
-
100
-
101
-
102
-
103
-
104
-
105
-
106
-
107
-
108
-
109
-
110
-
111
-
112
-
113
-
114
-
115
-
116
 |
 |
and remittance obligations related to the settlement of RSUs in connection with our IPO, with interest payable on
the borrowed amounts set at LIBOR plus 1.0%. We paid origination fees at closing of the Amended and Restated
Term Loan, which fees are being amortized over the term of the facility. We drew down the $1.5 billion of the
Amended and Restated Term Loan in October 2012 and paid an upfront fee of 0.15% on the loan amount, which
fee is being amortized over the remaining term of the facility. Any amounts outstanding will become due and
payable on October 25, 2015.
In connection with the draw down of the Amended and Restated Term Loan, to hedge our exposure to
interest rate fluctuation, we entered into an interest rate swap agreement. The net effect of this swap agreement is
to convert the variable interest rate to a fixed interest rate of 1.46%. The interest rate swap has a maturity date of
October 25, 2015.
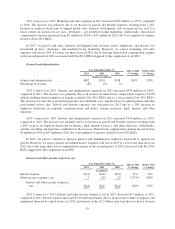
As of December 31, 2012, our income tax refundable of $451 million reflects the expected refund from
income tax loss carrybacks to 2010 and 2011. We expect to receive this refund in the first six months of 2013.
As of December 31, 2012, $565 million of the $9.63 billion in cash and cash equivalents and marketable
securities was held by our foreign subsidiaries. We have provided for the additional taxes that would be due if we
repatriated these funds for use in our operations in the United States.
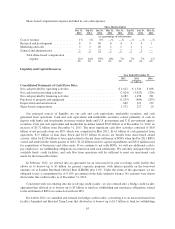
Cash Provided by Operating Activities
Cash flow from operating activities during 2012 primarily consisted of adjustments to net income for certain
non-cash items such as share-based compensation expense of $1.57 billion and total depreciation and
amortization of $649 million, partially offset by income tax refundable of $451 million. The cash flow from
operating activities during 2012 compared to 2011 increased modestly as the increases in adjustments for non-
cash items as described above were offset by a reduction in net income of $947 million and an increase in income
tax refundable.
Cash flow from operating activities during 2011 primarily resulted from net income of $1 billion, adjusted
for certain non-cash items, including depreciation and amortization of $323 million, and share-based
compensation expense of $217 million.
Cash flow from operating activities during 2010 primarily resulted from net income of $606 million,
adjusted for certain non-cash items, including depreciation and amortization of $139 million and share-based
compensation expense of $20 million, partially offset by cash consumed by working capital of $70 million.
Cash Used in Investing Activities
Cash used in investing activities during 2012 primarily resulted from $4.87 billion for the net purchase of
marketable securities, $1.24 billion for capital expenditures related to the purchase of servers, networking
equipment, storage infrastructure, and the construction of data centers as well as $911 million for acquisitions of
businesses and other assets, such as patents. The increase in cash used in investing activities during 2012
compared to 2011 was mainly due to increases in the purchase of marketable securities, acquisitions of
businesses and other assets, and capital expenditures.
Cash used in investing activities during 2011 primarily related to the use of approximately $2.4 billion for
the net purchase of marketable securities. Our cash used in investing activities in 2011 also consisted of capital
expenditures of $606 million related to the purchase of servers, networking equipment, storage infrastructure,
and the construction of data centers.
Cash used in investing activities during 2010 primarily consisted of capital expenditures related to the
purchases of property and equipment and the construction of data centers. Changes in restricted cash and deposits
consumed $9 million of cash related to security deposits in support of real estate expansion in 2010.
Acquisitions, net of cash acquired, also consumed $22 million of cash in 2010.
64