Facebook 2012 Annual Report Download - page 66
Download and view the complete annual report
Please find page 66 of the 2012 Facebook annual report below. You can navigate through the pages in the report by either clicking on the pages listed below, or by using the keyword search tool below to find specific information within the annual report.-
 1
1 -
2
-
3
-
4
-
5
-
6
-
7
-
8
-
9
-
10
-
11
-
12
-
13
-
14
-
15
-
16
-
17
-
18
-
19
-
20
-
21
-
22
-
23
-
24
-
25
-
26
-
27
-
28
-
29
-
30
-
31
-
32
-
33
-
34
-
35
-
36
-
37
-
38
-
39
-
40
-
41
-
42
-
43
-
44
-
45
-
46
-
47
-
48
-
49
-
50
-
51
-
52
-
53
-
54
-
55
-
 56
56 -
 57
57 -
 58
58 -
 59
59 -
 60
60 -
 61
61 -
 62
62 -
 63
63 -
 64
64 -
 65
65 -
 66
66 -
 67
67 -
 68
68 -
 69
69 -
 70
70 -
 71
71 -
 72
72 -
 73
73 -
 74
74 -
 75
75 -
 76
76 -
77
-
78
-
79
-
80
-
81
-
82
-
83
-
84
-
85
-
86
-
87
-
88
-
89
-
90
-
91
-
92
-
93
-
94
-
95
-
96
-
97
-
98
-
99
-
100
-
101
-
102
-
103
-
104
-
105
-
106
-
107
-
108
-
109
-
110
-
111
-
112
-
113
-
114
-
115
-
116
 |
 |

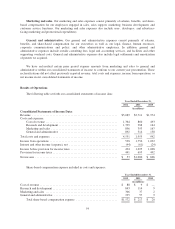
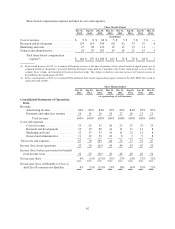
Share-based compensation expense included in costs and expenses:
Three Months Ended
Dec 31,
2012
Sep 30,
2012
Jun 30,
2012
Mar 31,
2012
Dec 31,
2011
Sep 30,
2011
Jun 30,
2011
Mar 31,
2011
(in millions)
Cost of revenue ....................... $ 9 $ 8 $ 66 $ 5 $ 3 $ 3 $ 3 $ —
Research and development .............. 124 114 545 60 42 33 35 4
Marketing and sales ................... 27 28 232 19 13 13 11 —
General and administrative .............. 24 29 263 19 18 21 15 3
Total share-based compensation
expense(2) ...................... $ 184 $ 179 $1,106 $ 103 $ 76 $ 70 $ 64 $ 7
(1) In the fourth quarter of 2012, we recorded all Payments revenue at the time of purchase of the related virtual or digital goods, net of
estimated refunds or chargebacks, instead of deferring Payment revenue until the expiration of the 30-day claim period, as we are able to
estimate future refunds and chargebacks based on historical trends. This charge resulted in a one-time increase in Payment revenue of
$66 million in the fourth quarter of 2012.
(2) In the second quarter of 2012, we recognized $986 million of share-based compensation expense related to Pre-2011 RSUs that vested in
connection with our IPO.
Three Months Ended
Dec 31,
2012
Sep 30,
2012
Jun 30,
2012
Mar 31,
2012
Dec 31,
2011
Sep 30,
2011
Jun 30,
2011
Mar 31,
2011
(as a percentage of total revenue)
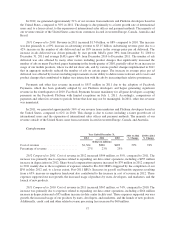
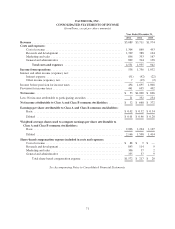
Consolidated Statements of Operations
Data:
Revenue:
Advertising revenue ............... 84% 86% 84% 82% 83% 84% 87% 87%
Payments and other fees revenue .... 16 14 16 18 17 16 13 13
Total revenue ................ 100% 100% 100% 100% 100% 100% 100% 100%
Costs and expenses:
Cost of revenue .................. 25 26 31 26 22 25 23 23
Research and development ......... 19 19 60 14 11 11 11 8
Marketing and sales ............... 12 13 33 14 11 12 11 8
General and administrative ......... 11 12 39 108998
Total costs and expenses ............... 67 70 163 64 52 57 55 47
Income (loss) from operations ........... 33 30 (63) 36 48 43 45 53
Income (loss) before (provision for) benefit
from income taxes .................. 32 29 (65) 36 46 40 45 54
Net income (loss) ..................... 4% (5)% (13)% 19% 27% 24% 27% 32%
Net income (loss) attributable to Class A
and Class B common stockholders ..... 4% (5)% (13)% 13% 18% 16% 18% 21%
62