Facebook 2012 Annual Report Download - page 77
Download and view the complete annual report
Please find page 77 of the 2012 Facebook annual report below. You can navigate through the pages in the report by either clicking on the pages listed below, or by using the keyword search tool below to find specific information within the annual report.-
 1
1 -
2
-
3
-
4
-
5
-
6
-
7
-
8
-
9
-
10
-
11
-
12
-
13
-
14
-
15
-
16
-
17
-
18
-
19
-
20
-
21
-
22
-
23
-
24
-
25
-
26
-
27
-
28
-
29
-
30
-
31
-
32
-
33
-
34
-
35
-
36
-
37
-
38
-
39
-
40
-
41
-
42
-
43
-
44
-
45
-
46
-
47
-
48
-
49
-
50
-
51
-
52
-
53
-
54
-
55
-
56
-
57
-
58
-
59
-
60
-
61
-
62
-
63
-
64
-
65
-
66
-
 67
67 -
 68
68 -
 69
69 -
 70
70 -
 71
71 -
 72
72 -
 73
73 -
 74
74 -
 75
75 -
 76
76 -
 77
77 -
 78
78 -
 79
79 -
 80
80 -
 81
81 -
 82
82 -
 83
83 -
 84
84 -
 85
85 -
 86
86 -
 87
87 -
88
-
89
-
90
-
91
-
92
-
93
-
94
-
95
-
96
-
97
-
98
-
99
-
100
-
101
-
102
-
103
-
104
-
105
-
106
-
107
-
108
-
109
-
110
-
111
-
112
-
113
-
114
-
115
-
116
 |
 |

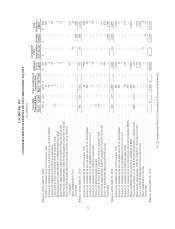
FACEBOOK, INC.
CONSOLIDATED STATEMENTS OF STOCKHOLDERS’ EQUITY
(In millions)
Convertible
Preferred Stock
Class A and Class B
Common Stock Additional
Paid-In
Capital
Accumulated
Other
Comprehensive
(Loss) Income
Retained
Earnings
Total
Stockholders’
EquityShares Amount Shares Par Value
Balances at December 31, 2009 ......................................... 543 $ 615 1,070 $ — $ 253 $ — $ — $ 868
Issuance of common stock, net of issuance costs ....................... — — 24 — 500 — — 500
Issuance of common stock for cash upon exercise of stock options ......... — — 70 — 6 — — 6
Issuance of common stock related to acquisitions ....................... — — 6 — 60 — — 60
Conversion of Series A preferred stock to common stock ................ (2) — 2 — — — — —
Reclassification of option liability to additional paid-in capital ............ — — — — 3 — — 3
Share-based compensation, related to employee share-based awards ........ — — — — 17 — — 17
Share-based compensation, related to nonemployee share-based awards ..... — — — — 1 — — 1
Excess tax benefit from share-based award activity, net of deferred
tax impact .................................................... — — — — 107 — — 107
Other comprehensive loss ......................................... — — — — — (6) — (6)
Net income ..................................................... — — — — — — 606 606
Balances at December 31, 2010 ......................................... 541 615 1,172 — 947 (6) 606 2,162
Issuance of common stock, net of issuance costs ....................... — — 48 — 998 — — 998
Issuance of common stock for cash upon exercise of stock options ......... — — 102 — 28 — — 28
Issuance of common stock to nonemployees for past services ............. — — — — 3 — — 3
Issuance of common stock related to acquisitions ....................... — — 2 — 58 — — 58
Exercise of preferred stock warrants ................................. 8 — — — — — — —
Conversion of Series B & C preferred stock to common stock ............. (6) — 6 — — — — —
Share-based compensation, related to employee share-based awards ........ — — — — 217 — — 217
Excess tax benefit from share-based award activity ..................... — — — — 433 — — 433
Net income ..................................................... — — — — — — 1,000 1,000
Balances at December 31, 2011 ......................................... 543 615 1,330 — 2,684 (6) 1,606 4,899
Issuance of common stock, net of issuance costs ....................... — — 180 — 6,760 — — 6,760
Issuance of common stock for cash upon exercise of stock options ......... — — 135 — 17 — — 17
Issuance of common stock to nonemployees for past services ............. — — — — 1 — — 1
Issuance of common stock related to acquisitions ....................... — — 26 — 274 — — 274
Issuance of common stock for settlement of restricted stock units (RSUs) . . . — — 279 — — — — —
Shares withheld related to net share settlement of RSUs ................. — — (123) — (2,862) — — (2,862)
Conversion of Series A, B, C, D & E preferred stock to common stock ...... (543) (615) 545 — 615 — — —
Share-based compensation, related to employee share-based awards ........ — — — — 1,572 — — 1,572
Excess tax benefit from share-based award activity ..................... — — — — 1,033 — — 1,033
Other comprehensive income ...................................... — — — — — 8 — 8
Net income ..................................................... — — — — — — 53 53
Balances at December 31, 2012 ......................................... — $ — 2,372 $ — $10,094 $ 2 $ 1,659 $11,755
See Accompanying Notes to Consolidated Financial Statements.
73