Facebook 2012 Annual Report Download - page 52
Download and view the complete annual report
Please find page 52 of the 2012 Facebook annual report below. You can navigate through the pages in the report by either clicking on the pages listed below, or by using the keyword search tool below to find specific information within the annual report.-
 1
1 -
2
-
3
-
4
-
5
-
6
-
7
-
8
-
9
-
10
-
11
-
12
-
13
-
14
-
15
-
16
-
17
-
18
-
19
-
20
-
21
-
22
-
23
-
24
-
25
-
26
-
27
-
28
-
29
-
30
-
31
-
32
-
33
-
34
-
35
-
36
-
37
-
38
-
39
-
40
-
41
-
 42
42 -
 43
43 -
 44
44 -
 45
45 -
 46
46 -
 47
47 -
 48
48 -
 49
49 -
 50
50 -
 51
51 -
 52
52 -
 53
53 -
 54
54 -
 55
55 -
 56
56 -
 57
57 -
 58
58 -
 59
59 -
 60
60 -
 61
61 -
 62
62 -
63
-
64
-
65
-
66
-
67
-
68
-
69
-
70
-
71
-
72
-
73
-
74
-
75
-
76
-
77
-
78
-
79
-
80
-
81
-
82
-
83
-
84
-
85
-
86
-
87
-
88
-
89
-
90
-
91
-
92
-
93
-
94
-
95
-
96
-
97
-
98
-
99
-
100
-
101
-
102
-
103
-
104
-
105
-
106
-
107
-
108
-
109
-
110
-
111
-
112
-
113
-
114
-
115
-
116
 |
 |
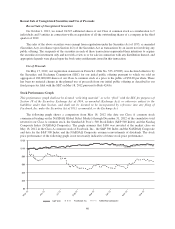
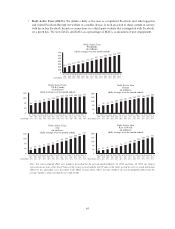
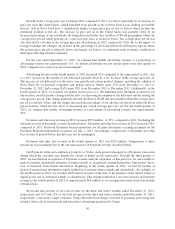
For 2012, worldwide ARPU was $5.32, an increase of 6% from 2011. ARPU increased in 2012 by
approximately 20% in the United States & Canada and Rest of World, by approximately 15% in Asia and 8% in
Europe compared to 2011. During the fourth quarter of 2012, worldwide ARPU was $1.54, an increase of 12%
from the fourth quarter of 2011. Over this period, ARPU increased by approximately 37% in Rest of World, by
over 20% in United States & Canada and Asia, and by approximately 7% in Europe. User growth was more rapid
in geographies with relatively lower ARPU, such as Asia and Rest of World. We expect that user growth in the
future will continue to be higher in those regions where ARPU is relatively lower, such as Asia and Rest of
World, such that worldwide ARPU may continue to increase at a slower rate relative to ARPU in any geographic
region, or potentially decrease even if ARPU increases in each geographic region. We also expect worldwide
ARPU will decline in the first quarter of 2013 driven by seasonality, which is consistent with historical trends.
Factors Affecting Our Performance
Number of MAUs and DAUs. Trends in our MAUs and DAUs affect our revenue and financial results by
influencing the number of ads we are able to show, the volume of Payments transactions, as well as our expenses
and capital expenditures. In 2012, MAUs increased by 25% and DAUs increased by 28%. We expect our growth
rates for MAUs and DAUs to decline as the size of our active user base increases and as we achieve higher
market penetration rates. Additionally, as we grow our business and expand internationally, we expect to face
challenges entering new markets such as China, where access to Facebook is restricted in whole or in part. As
user growth rates slow, we expect the rate of growth in revenue will likely decline over time, which will affect
our income from operations and net income.
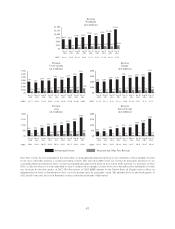
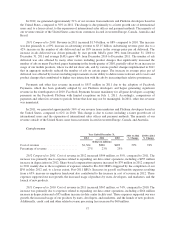
User Geography. The geography of our users affects our revenue and financial results because we currently
monetize users in different geographies at different average rates. For example, ARPU for an average user in
United States & Canada is more than five times higher than for an average user in Asia. User geography also has
some impact on our costs, though in general new users in Asia and Rest of World do not require material
incremental infrastructure investments because we are able to utilize existing infrastructure such as our data
centers in the United States to make our products available to these users. In addition, user growth by geography
does not necessarily affect our overall headcount requirements or headcount-related expenses since we are
generally able to support users in all geographies from our existing facilities. In 2012, we grew users relatively
faster in Asia and Rest of World where on average users generate less revenue as compared with users in the
United States or Europe. In the future, we expect to continue to grow more rapidly in Asia and Rest of World
markets where our current penetration rates are lower. We plan to continue to invest in user growth across the
world, including in geographies where current per user monetization is relatively lower.
User Engagement. Changes in user engagement as measured by metrics such as frequency of visitation will
also affect our revenue and financial performance. Growth in user engagement should generally increase the
opportunities for us to display advertising and to deliver relevant commercial content to users. Growth in user
engagement also generally results in increases in our expenses and capital expenditures required to support user
activity. User engagement as measured by DAUs as a percentage of MAUs increased from 57% at the end of
2011 to 59% at the end of 2012. Our product development investments are focused on increasing user
engagement over time.
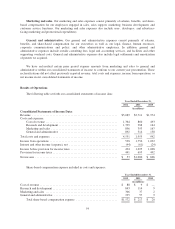
Facebook Usage on Mobile Devices. Increasing Facebook use on mobile devices may affect our revenue
and financial results as we currently show fewer ads on average to mobile users compared to users on personal
computers. The lower volume of ads per mobile user is partially offset by the higher price per ad for mobile, and
we are investing to try to make our mobile ads more valuable over time. In 2012, we began showing ads in
mobile users’ News Feeds, and for the fourth quarter of 2012 and for the year ended December 31, 2012, we
estimate that approximately 23% and 11% of our ads revenue came from mobile products, respectively. We
expect mobile usage to increase at a faster rate than usage through personal computers for the foreseeable future,
particularly in developed markets, and our success in ramping up mobile monetization will likely have a material
impact on our financial performance.
48