Facebook 2012 Annual Report Download - page 93
Download and view the complete annual report
Please find page 93 of the 2012 Facebook annual report below. You can navigate through the pages in the report by either clicking on the pages listed below, or by using the keyword search tool below to find specific information within the annual report.-
 1
1 -
2
-
3
-
4
-
5
-
6
-
7
-
8
-
9
-
10
-
11
-
12
-
13
-
14
-
15
-
16
-
17
-
18
-
19
-
20
-
21
-
22
-
23
-
24
-
25
-
26
-
27
-
28
-
29
-
30
-
31
-
32
-
33
-
34
-
35
-
36
-
37
-
38
-
39
-
40
-
41
-
42
-
43
-
44
-
45
-
46
-
47
-
48
-
49
-
50
-
51
-
52
-
53
-
54
-
55
-
56
-
57
-
58
-
59
-
60
-
61
-
62
-
63
-
64
-
65
-
66
-
67
-
68
-
69
-
70
-
71
-
72
-
73
-
74
-
75
-
76
-
77
-
78
-
79
-
80
-
81
-
82
-
 83
83 -
 84
84 -
 85
85 -
 86
86 -
 87
87 -
 88
88 -
 89
89 -
 90
90 -
 91
91 -
 92
92 -
 93
93 -
 94
94 -
 95
95 -
 96
96 -
 97
97 -
 98
98 -
 99
99 -
 100
100 -
 101
101 -
 102
102 -
 103
103 -
104
-
105
-
106
-
107
-
108
-
109
-
110
-
111
-
112
-
113
-
114
-
115
-
116
 |
 |

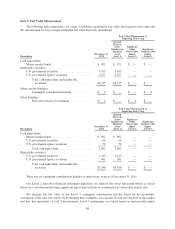
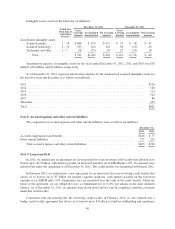
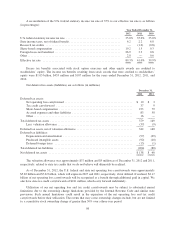
that are supported by little or no market activity and reflect our own assumptions in measuring fair value. Our
fair value estimate of this liability was $6 million at the date of acquisition. Changes in the fair value of the
contingent consideration liability subsequent to the acquisition date, such as changes in the probability
assessment and our stock prices, are recognized in earnings in the period when the change in the estimated fair
value occurs.
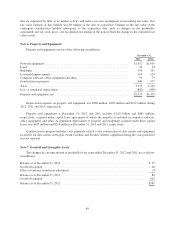
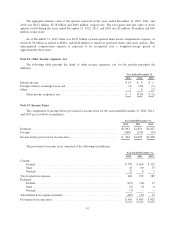
Note 6. Property and Equipment
Property and equipment consists of the following (in millions):
December 31,
2012 2011
Network equipment .......................................................... $1,912 $1,016
Land ...................................................................... 36 34
Buildings .................................................................. 594 355
Leasehold improvements ...................................................... 194 120
Computer software, office equipment and other .................................... 93 73
Construction in progress ...................................................... 444 327
Total ..................................................................... 3,273 1,925
Less: accumulated depreciation ................................................ (882) (450)
Property and equipment, net ................................................... $2,391 $1,475
Depreciation expense on property and equipment was $566 million, $303 million and $129 million during
2012, 2011 and 2010, respectively.
Property and equipment at December 31, 2012 and 2011 includes $1.28 billion and $881 million,
respectively, acquired under capital lease agreements of which the majority is included in computer software,
office equipment, and other. Accumulated depreciation of property and equipment acquired under these capital
leases was $437 million and $210 million at December 31, 2012 and 2011, respectively.
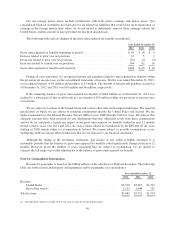
Construction in progress includes costs primarily related to the construction of data centers and equipment
located in our data centers in Oregon, North Carolina, and Sweden. Interest capitalized during the years presented
was not material.
Note 7. Goodwill and Intangible Assets
The changes in carrying amount of goodwill for the years ended December 31, 2012 and 2011 are as follows
(in millions):
Balance as of December 31, 2010 ......................................................... $ 37
Goodwill acquired ..................................................................... 48
Effect of currency translation adjustment ................................................... (3)
Balance as of December 31, 2011 ......................................................... 82
Goodwill acquired ..................................................................... 505
Balance as of December 31, 2012 ......................................................... $587
89