Facebook 2012 Annual Report Download - page 61
Download and view the complete annual report
Please find page 61 of the 2012 Facebook annual report below. You can navigate through the pages in the report by either clicking on the pages listed below, or by using the keyword search tool below to find specific information within the annual report.-
 1
1 -
2
-
3
-
4
-
5
-
6
-
7
-
8
-
9
-
10
-
11
-
12
-
13
-
14
-
15
-
16
-
17
-
18
-
19
-
20
-
21
-
22
-
23
-
24
-
25
-
26
-
27
-
28
-
29
-
30
-
31
-
32
-
33
-
34
-
35
-
36
-
37
-
38
-
39
-
40
-
41
-
42
-
43
-
44
-
45
-
46
-
47
-
48
-
49
-
50
-
 51
51 -
 52
52 -
 53
53 -
 54
54 -
 55
55 -
 56
56 -
 57
57 -
 58
58 -
 59
59 -
 60
60 -
 61
61 -
 62
62 -
 63
63 -
 64
64 -
 65
65 -
 66
66 -
 67
67 -
 68
68 -
 69
69 -
 70
70 -
 71
71 -
72
-
73
-
74
-
75
-
76
-
77
-
78
-
79
-
80
-
81
-
82
-
83
-
84
-
85
-
86
-
87
-
88
-
89
-
90
-
91
-
92
-
93
-
94
-
95
-
96
-
97
-
98
-
99
-
100
-
101
-
102
-
103
-
104
-
105
-
106
-
107
-
108
-
109
-
110
-
111
-
112
-
113
-
114
-
115
-
116
 |
 |

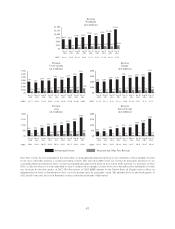
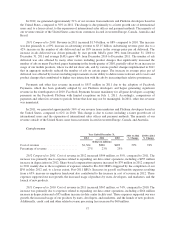
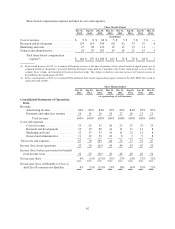
In 2012, we generated approximately 51% of our revenue from marketers and Platform developers based in
the United States, compared to 56% in 2011. The change is due primarily to a faster growth rate of international
users and, to a lesser extent, to the expansion of international sales offices and payment methods. The majority of
our revenue outside of the United States came from customers located in western Europe, Canada, Australia and
Brazil.
2011 Compared to 2010. Revenue in 2011 increased $1.74 billion, or 88% compared to 2010. The increase
was due primarily to a 69% increase in advertising revenue to $3.15 billion. Advertising revenue grew due to a
42% increase in the number of ads delivered and an 18% increase in the average price per ad delivered. The
increase in ads delivered was driven primarily by user growth; MAUs grew 39% from December 31, 2010 to
December 31, 2011 and average DAUs grew 48% from December 2010 to December 2011. The number of ads
delivered was also affected by many other factors including product changes that significantly increased the
number of ads on many Facebook pages beginning in the fourth quarter of 2010, partially offset by an increase in
usage of our mobile products, where we did not show ads, and by various product changes implemented in 2011
that in aggregate modestly reduced the number of ads on certain pages. The increase in average price per ad
delivered was affected by factors including improvements in our ability to deliver more relevant ads to users and
product changes that contributed to higher user interaction with the ads by increasing their relative prominence.
Payments and other fees revenue increased to $557 million in 2011 due to the adoption of Facebook
Payments, which has been gradually adopted by our Platform developers and began generating significant
revenue in the fourth quarter of 2010. Facebook Payments became mandatory for all game developers accepting
payments on the Facebook Platform with limited exceptions on July 1, 2011. Accordingly, comparisons of
payments and other fees revenue to periods before that date may not be meaningful. In 2011, other fees revenue
was immaterial.
In 2011, we generated approximately 56% of our revenue from marketers and Platform developers based in
the United States, compared to 62% in 2010. This change is due to factors including a faster growth rate of
international users and the expansion of international sales offices and payment methods. The majority of our
revenue outside of the United States came from customers located in western Europe, Canada, and Australia.
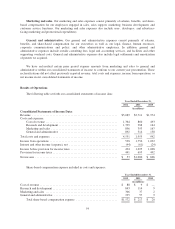
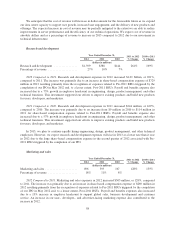
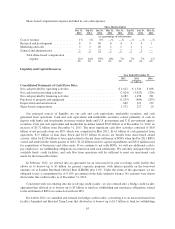
Cost of revenue
Year Ended December 31, 2011 to 2012
% Change
2010 to 2011
% Change2012 2011 2010
(dollars in millions)
Cost of revenue ......................... $1,364 $860 $493 59% 74%
Percentage of revenue .................... 27% 23% 25%
2012 Compared to 2011. Cost of revenue in 2012 increased $504 million, or 59%, compared to 2011. The
increase was primarily due to expenses related to expanding our data center operations, including a $257 million
increase in depreciation in 2012. Share-based compensation expense increased by $79 million in 2012 compared
to 2011 mainly due to the recognition of expenses related to Pre-2011 RSUs triggered by the completion of our
IPO in May 2012 and, to a lesser extent, Post-2011 RSUs. Increases in payroll and benefits expenses resulting
from a 65% increase in employee headcount also contributed to the increase in cost of revenue in 2012. These
expenses supported our user growth, the increased usage of products by users, developers, and marketers, and the
launch of new products.
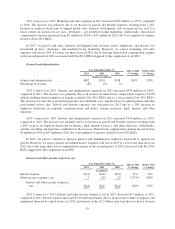
2011 Compared to 2010. Cost of revenue in 2011 increased $367 million, or 74%, compared to 2010. The
increase was primarily due to expenses related to expanding our data center operations, including a $164 million
increase in depreciation and a $35 million increase in data center facility rent. These expenses supported our user
growth, the increased usage of our products by users, developers, and marketers, and the launch of new products.
Additionally, credit card and other related revenue processing fees increased by $60 million.
57