Facebook 2012 Annual Report Download - page 101
Download and view the complete annual report
Please find page 101 of the 2012 Facebook annual report below. You can navigate through the pages in the report by either clicking on the pages listed below, or by using the keyword search tool below to find specific information within the annual report.-
 1
1 -
2
-
3
-
4
-
5
-
6
-
7
-
8
-
9
-
10
-
11
-
12
-
13
-
14
-
15
-
16
-
17
-
18
-
19
-
20
-
21
-
22
-
23
-
24
-
25
-
26
-
27
-
28
-
29
-
30
-
31
-
32
-
33
-
34
-
35
-
36
-
37
-
38
-
39
-
40
-
41
-
42
-
43
-
44
-
45
-
46
-
47
-
48
-
49
-
50
-
51
-
52
-
53
-
54
-
55
-
56
-
57
-
58
-
59
-
60
-
61
-
62
-
63
-
64
-
65
-
66
-
67
-
68
-
69
-
70
-
71
-
72
-
73
-
74
-
75
-
76
-
77
-
78
-
79
-
80
-
81
-
82
-
83
-
84
-
85
-
86
-
87
-
88
-
89
-
90
-
 91
91 -
 92
92 -
 93
93 -
 94
94 -
 95
95 -
 96
96 -
 97
97 -
 98
98 -
 99
99 -
 100
100 -
 101
101 -
 102
102 -
 103
103 -
 104
104 -
 105
105 -
 106
106 -
 107
107 -
 108
108 -
 109
109 -
 110
110 -
 111
111 -
112
-
113
-
114
-
115
-
116
 |
 |

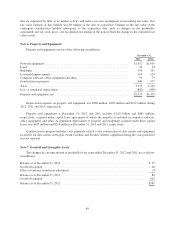
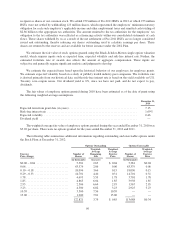
The aggregate intrinsic value of the options exercised in the years ended December 31, 2012, 2011, and
2010 was $4.23 billion, $2.38 billion and $492 million, respectively. The total grant date fair value of stock
options vested during the years ended December 31, 2012, 2011, and 2010 was $5 million, $6 million and $16
million, respectively.
As of December 31, 2012, there was $2.21 billion of unrecognized share-based compensation expense, of
which $1.96 billion is related to RSUs, and $244 million is related to restricted shares and stock options. This
unrecognized compensation expense is expected to be recognized over a weighted-average period of
approximately three years.
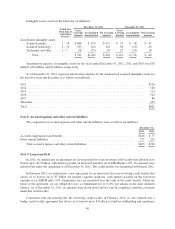
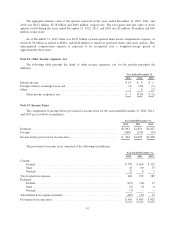
Note 12. Other income (expense), net
The following table presents the detail of other income (expense), net, for the periods presented (in
millions):
Year Ended December 31,
2012 2011 2010
Interest income ....................................................... $14 $ 4 $ 1
Foreign currency exchange losses, net ..................................... (9) (29) (1)
Other ............................................................... 2 6 (2)
Other income (expense), net ......................................... $ 7 $(19) $ (2)
Note 13. Income Taxes
The components of income before provision for income taxes for the years ended December 31, 2012, 2011,
and 2010 are as follows (in millions):
Year Ended December 31,
2012 2011 2010
Domestic .......................................................... $1,062 $1,819 $1,027
Foreign ........................................................... (568) (124) (19)
Income before provision for income taxes ................................ $ 494 $1,695 $1,008
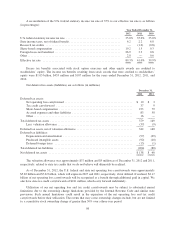
The provision for income taxes consisted of the following (in millions):
Year Ended December 31,
2012 2011 2010
Current:
Federal .......................................................... $559 $664 $325
State ............................................................ 45 60 57
Foreign ......................................................... 22 8 1
Total current tax expense ............................................... 626 732 383
Deferred:
Federal .......................................................... (172) (34) 13
State ............................................................ (6) (3) 6
Foreign ......................................................... (7) — —
Total deferred tax expense (benefit) ....................................... (185) (37) 19
Provision for income taxes .............................................. $441 $695 $402
97