Facebook 2012 Annual Report Download - page 78
Download and view the complete annual report
Please find page 78 of the 2012 Facebook annual report below. You can navigate through the pages in the report by either clicking on the pages listed below, or by using the keyword search tool below to find specific information within the annual report.-
 1
1 -
2
-
3
-
4
-
5
-
6
-
7
-
8
-
9
-
10
-
11
-
12
-
13
-
14
-
15
-
16
-
17
-
18
-
19
-
20
-
21
-
22
-
23
-
24
-
25
-
26
-
27
-
28
-
29
-
30
-
31
-
32
-
33
-
34
-
35
-
36
-
37
-
38
-
39
-
40
-
41
-
42
-
43
-
44
-
45
-
46
-
47
-
48
-
49
-
50
-
51
-
52
-
53
-
54
-
55
-
56
-
57
-
58
-
59
-
60
-
61
-
62
-
63
-
64
-
65
-
66
-
67
-
 68
68 -
 69
69 -
 70
70 -
 71
71 -
 72
72 -
 73
73 -
 74
74 -
 75
75 -
 76
76 -
 77
77 -
 78
78 -
 79
79 -
 80
80 -
 81
81 -
 82
82 -
 83
83 -
 84
84 -
 85
85 -
 86
86 -
 87
87 -
 88
88 -
89
-
90
-
91
-
92
-
93
-
94
-
95
-
96
-
97
-
98
-
99
-
100
-
101
-
102
-
103
-
104
-
105
-
106
-
107
-
108
-
109
-
110
-
111
-
112
-
113
-
114
-
115
-
116
 |
 |

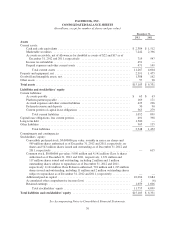
FACEBOOK, INC.
CONSOLIDATED STATEMENTS OF CASH FLOWS
(In millions)
Year Ended December 31,
2012 2011 2010
Cash flows from operating activities
Net income .................................................. $ 53 $ 1,000 $ 606
Adjustments to reconcile net income to net cash provided by operating
activities:
Depreciation and amortization ............................... 649 323 139
Loss on write-off of equipment .............................. 15 4 3
Share-based compensation .................................. 1,572 217 20
Deferred income taxes ..................................... (186) (30) 23
Tax benefit from share-based award activity .................... 1,033 433 115
Excess tax benefit from share-based award activity .............. (1,033) (433) (115)
Changes in assets and liabilities:
Accounts receivable ....................................... (170) (174) (209)
Income tax refundable ..................................... (451) — —
Prepaid expenses and other current assets ...................... (14) (24) (38)
Other assets ............................................. 2 (5) (6)
Accounts payable ......................................... 1 6 12
Platform partners payable .................................. (2) 96 75
Accrued expenses and other current liabilities ................... 160 37 20
Deferred revenue and deposits ............................... (60) 49 37
Other liabilities ........................................... 43 50 16
Net cash provided by operating activities ........................ 1,612 1,549 698
Cash flows from investing activities
Purchases of property and equipment ............................. (1,235) (606) (293)
Purchases of marketable securities ................................ (10,307) (3,025) —
Sales of marketable securities ................................... 2,100 113 —
Maturities of marketable securities ............................... 3,333 516 —
Investments in non-marketable equity securities ..................... (2) (3) —
Acquisitions of businesses, net of cash acquired, and purchases of
intangible and other assets .................................... (911) (24) (22)
Change in restricted cash and deposits ............................. (2) 6 (9)
Net cash used in investing activities ............................. (7,024) (3,023) (324)
Cash flows from financing activities
Net proceeds from issuance of common stock ....................... 6,760 998 500
Taxes paid related to net share settlement of equity awards ............ (2,862) — —
Proceeds from exercise of stock options ........................... 17 28 6
Proceeds from long-term debt, net of issuance cost ................... 1,496 — 250
Repayment of long-term debt .................................... — (250) —
Proceeds from sale and lease-back transactions ...................... 205 170 —
Principal payments on capital lease obligations ...................... (366) (181) (90)
Excess tax benefit from share-based award activity .................. 1,033 433 115
Net cash provided by financing activities ......................... 6,283 1,198 781
Effect of exchange rate changes on cash and cash equivalents .............. 1 3 (3)
Net increase (decrease) in cash and cash equivalents ..................... 872 (273) 1,152
Cash and cash equivalents at beginning of period ........................ 1,512 1,785 633
Cash and cash equivalents at end of period ........................... $ 2,384 $ 1,512 $ 1,785
See Accompanying Notes to Consolidated Financial Statements.
74