GE 2012 Annual Report Download - page 101
Download and view the complete annual report
Please find page 101 of the 2012 GE annual report below. You can navigate through the pages in the report by either clicking on the pages listed below, or by using the keyword search tool below to find specific information within the annual report.-
 1
1 -
2
-
3
-
4
-
5
-
6
-
7
-
8
-
9
-
10
-
11
-
12
-
13
-
14
-
15
-
16
-
17
-
18
-
19
-
20
-
21
-
22
-
23
-
24
-
25
-
26
-
27
-
28
-
29
-
30
-
31
-
32
-
33
-
34
-
35
-
36
-
37
-
38
-
39
-
40
-
41
-
42
-
43
-
44
-
45
-
46
-
47
-
48
-
49
-
50
-
51
-
52
-
53
-
54
-
55
-
56
-
57
-
58
-
59
-
60
-
61
-
62
-
63
-
64
-
65
-
66
-
67
-
68
-
69
-
70
-
71
-
72
-
73
-
74
-
75
-
76
-
77
-
78
-
79
-
80
-
81
-
82
-
83
-
84
-
85
-
86
-
87
-
88
-
89
-
90
-
 91
91 -
 92
92 -
 93
93 -
 94
94 -
 95
95 -
 96
96 -
 97
97 -
 98
98 -
 99
99 -
 100
100 -
 101
101 -
 102
102 -
 103
103 -
 104
104 -
 105
105 -
 106
106 -
 107
107 -
 108
108 -
 109
109 -
 110
110 -
 111
111 -
112
-
113
-
114
-
115
-
116
-
117
-
118
-
119
-
120
-
121
-
122
-
123
-
124
-
125
-
126
-
127
-
128
-
129
-
130
-
131
-
132
-
133
-
134
-
135
-
136
-
137
-
138
-
139
-
140
-
141
-
142
-
143
-
144
-
145
-
146
-
147
-
148
-
149
-
150
 |
 |

GE 2012 ANNUAL REPORT 99
notes to consolidated financial statements
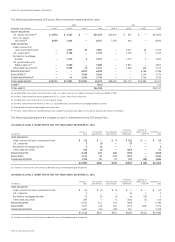
INTANGIBLE ASSETS SUBJECT TO AMORTIZATION
December 31 (In millions)
Gross
carrying
amount
Accumulated
amortization Net
GE
2012
Customer-related $ 5,751 $(1,353) $ 4,398
Patents, licenses and trademarks 5,981 (2,435) 3,546
Capitalized software 5,411 (3,010) 2,401
All other 360 (164) 196
Total $17,503 $(6,962) $10,541
2011
Customer-related $ 5,638 $ (1,117) $ 4,521
Patents, licenses and trademarks 5,797 (2,104) 3,693
Capitalized software 4,743 (2,676) 2,067
All other 176 (140) 36
Total $16,354 $(6,037) $10,317
GECC
2012
Customer-related $ 1,227 $ (808) $ 419
Patents, licenses and trademarks 191 (160) 31
Capitalized software 2,126 (1,681) 445
Lease valuations 1,163 (792) 371
Present value of future profits (a) 530 (530) —
All other 283 (255) 28
Total $ 5,520 $(4,226) $ 1,294
2011
Customer-related $ 1,186 $ (697) $ 489
Patents, licenses and trademarks 250 (208) 42
Capitalized software 2,048 (1,597) 451
Lease valuations 1,470 (944) 526
Present value of future profits (a) 491 (491) —
All other 327 (289) 38
Total $ 5,772 $ (4,226) $ 1,546
(a) Balances at December 31, 2012 and 2011 reflect adjustments of $353 million and
$391 million, respectively, to the present value of future profits in our run-off
insurance operations to reflect the effects that would have been recognized had
the related unrealized investment securities holding gains and losses actually
been realized in accordance with ASC 320-10-S99-2.
During 2012, we recorded additions to intangible assets subject
to amortization of $1,302 million, primarily from the capital-
ization of new software across several business platforms as
well as from the acquisitions of Industrea Limited and Railcar
Management, Inc. at Transportation and the acquisition of
U-Systems, Inc. at Healthcare. The components of finite-lived
intangible assets acquired during 2012 and their respective
weighted-average amortizable period are: $83 million—
Customer-related (9.7 years); $135 million—Patents, licenses
and trademarks (12.3 years); $896 million—Capitalized software
(5.9 years); and $188 million—All other (7.6 years).
Consolidated amortization related to intangible assets was
$1,615 million, $1,748 million and $1,757 million for 2012, 2011
and 2010, respectively. We estimate annual pre-tax amortiza-
tion for intangible assets over the next five calendar years to be
as follows: 2013—$1,528 million; 2014—$1,333 million; 2015—
$1,205 million; 2016—$1,075 million; and 2017—$928 million.
Note 9.
All Other Assets
December 31 (In millions) 2012 2011
GE
Investments
Associated companies (a) $ 22,169 $ 20,463
Other 445 607
22,614 21,070
Contract costs and estimated earnings (b) 9,443 9,008
Long-term receivables, including notes (c) 714 1,316
Derivative instruments 383 370
Other 4,782 4,911
37,936 36,675
GECC
Investments
Real estate (d) (e) 25,154 28,255
Associated companies 19,119 23,589
Assets held for sale (f) 4,205 4,525
Cost method (e) 1,665 1,882
Other 1,446 1,722
51,589 59,973
Derivative instruments 3,557 9,671
Advances to suppliers 1,813 1,560
Deferred borrowing costs (g) 940 1,327
Deferred acquisition costs (h) 46 55
Other 4,272 3,026
62,217 75,612
ELIMINATIONS (77) (586)
Total $100,076 $111,701
(a) Included our investment in NBCU LLC of $18,887 million and $17,955 million at
December 31, 2012 and 2011, respectively. At December 31, 2012 and 2011, we
also had $4,937 million and $4,699 million, respectively, of deferred tax liabilities
related to this investment. See Note 14.
(b) Contract costs and estimated earnings reflect revenues earned in excess of
billings on our long-term contracts to construct technically complex equipment
(such as power generation, aircraft engines and aeroderivative units) and long-
term product maintenance or extended warranty arrangements. These amounts
are presented net of related billings in excess of revenues of $1,498 million and
$1,305 million at December 31, 2012 and 2011, respectively.
(c) Included loans to GECC of $3 million and $388 million at December 31, 2012 and
2011, respectively.
(d) GECC investments in real estate consisted principally of two categories: real estate
held for investment and equity method investments. Both categories contained a
wide range of properties including the following at December 31, 2012: office
buildings (48%), apartment buildings (14%), retail facilities (9%), franchise
properties (9%), industrial properties (8%) and other (12%). At December 31, 2012,
investments were located in the Americas (45%), Europe (28%) and Asia (27%).
(e) The fair value of and unrealized loss on cost method investments in a continuous
loss position for less than 12 months at December 31, 2012, were $142 million and
$37 million, respectively. The fair value of and unrealized loss on cost method
investments in a continuous loss position for 12 months or more at December 31,
2012, were $2 million and an insignificant amount, respectively. The fair value of
and unrealized loss on cost method investments in a continuous loss position for
less than 12 months at December 31, 2011, were $425 million and $61 million,
respectively. The fair value of and unrealized loss on cost method investments in a
continuous loss position for 12 months or more at December 31, 2011, were
$65 million and $3 million, respectively.
(f) Assets were classified as held for sale on the date a decision was made to dispose
of them through sale or other means. At December 31, 2012 and 2011, such assets
consisted primarily of loans, aircraft, equipment and real estate properties, and
were accounted for at the lower of carrying amount or estimated fair value less
costs to sell. These amounts are net of valuation allowances of $200 million and
$122 million at December 31, 2012 and 2011, respectively.
(g) Included $329 million at December 31, 2011, of unamortized fees related to our
participation in the Temporary Liquidity Guarantee Program (TLGP). At
December 31, 2012, our debt under TLGP was fully repaid.
(h) Balances at December 31, 2012 and 2011 reflect adjustments of $764 million and
$810 million, respectively, to deferred acquisition costs in our run-off insurance
operations to reflect the effects that would have been recognized had the related
unrealized investment securities holding gains and losses actually been realized in
accordance with ASC 320-10-S99-2.