GE 2012 Annual Report Download - page 134
Download and view the complete annual report
Please find page 134 of the 2012 GE annual report below. You can navigate through the pages in the report by either clicking on the pages listed below, or by using the keyword search tool below to find specific information within the annual report.-
 1
1 -
2
-
3
-
4
-
5
-
6
-
7
-
8
-
9
-
10
-
11
-
12
-
13
-
14
-
15
-
16
-
17
-
18
-
19
-
20
-
21
-
22
-
23
-
24
-
25
-
26
-
27
-
28
-
29
-
30
-
31
-
32
-
33
-
34
-
35
-
36
-
37
-
38
-
39
-
40
-
41
-
42
-
43
-
44
-
45
-
46
-
47
-
48
-
49
-
50
-
51
-
52
-
53
-
54
-
55
-
56
-
57
-
58
-
59
-
60
-
61
-
62
-
63
-
64
-
65
-
66
-
67
-
68
-
69
-
70
-
71
-
72
-
73
-
74
-
75
-
76
-
77
-
78
-
79
-
80
-
81
-
82
-
83
-
84
-
85
-
86
-
87
-
88
-
89
-
90
-
91
-
92
-
93
-
94
-
95
-
96
-
97
-
98
-
99
-
100
-
101
-
102
-
103
-
104
-
105
-
106
-
107
-
108
-
109
-
110
-
111
-
112
-
113
-
114
-
115
-
116
-
117
-
118
-
119
-
120
-
121
-
122
-
123
-
 124
124 -
 125
125 -
 126
126 -
 127
127 -
 128
128 -
 129
129 -
 130
130 -
 131
131 -
 132
132 -
 133
133 -
 134
134 -
 135
135 -
 136
136 -
 137
137 -
 138
138 -
 139
139 -
 140
140 -
 141
141 -
 142
142 -
 143
143 -
 144
144 -
145
-
146
-
147
-
148
-
149
-
150
 |
 |

132 GE 2012 ANNUAL REPORT
notes to consolidated financial statements
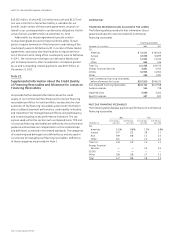
The table below summarizes the assets and liabilities of consolidated VIEs described above.
Consolidated Securitization Entities
December 31 (In millions) Trinity (a) Credit cards (b) Equipment (b) Real estate (c) Trade
receivables Other Total
2012
ASSETS (d)
Financing receivables, net $ — $24,169 $12,456 $ 50 $2,339 $1,902 $40,916
Investment securities 3,435————1,0514,486
Other assets 217 29 360 — — 2,428 3,034
Total $3,652 $24,198 $12,816 $ 50 $2,339 $5,381 $48,436
LIABILITIES (d)
Borrowings $ — $ — $ — $ — $ — $ 711 $ 711
Non-recourse borrowings — 17,208 9,811 54 2,050 — 29,123
Other liabilities 1,656 146 11 2 8 1,213 3,036
Total $1,656 $17,354 $ 9,822 $ 56 $2,058 $1,924 $32,870
2011
ASSETS
(d)
Financing receivables, net $ — $19,229 $10,523 $3,521 $1,614 $2,973 $37,860
Investment securities 4,289————1,0315,320
Other assets 389 17 283 210 — 2,636 3,535
Total $4,678 $19,246 $10,806 $3,731 $1,614 $6,640 $46,715
LIABILITIES
(d)
Borrowings $ —$ — $ 2 $ 25 $ — $ 821 $ 848
Non-recourse borrowings — 14,184 8,166 3,659 1,769 980 28,758
Other liabilities 4,456 37 — 19 23 1,071 5,606
Total $4,456 $14,221 $ 8,168 $3,703 $1,792 $2,872 $35,212
(a) Excludes intercompany advances from GECC to Trinity, which are eliminated in consolidation of $2,441 million and $1,006 million at December 31, 2012 and 2011, respectively.
(b) We provide servicing to the CSEs and are contractually permitted to commingle cash collected from customers on financing receivables sold to CSE investors with our own
cash prior to payment to a CSE, provided our short-term credit rating does not fall below A-1/P-1. These CSEs also owe us amounts for purchased financial assets and
scheduled interest and principal payments. At December 31, 2012 and 2011, the amounts of commingled cash owed to the CSEs were $6,225 million and $5,655 million,
respectively, and the amounts owed to us by CSEs were $6,143 million and $5,165 million, respectively.
(c) On October 1, 2012, we completed the sale of our Business Property business, which included servicing rights for its CSEs. We deconsolidated these CSEs in the fourth
quarter of 2012 as we no longer have the power to direct the activities of these entities.
(d) Asset amounts exclude intercompany receivables for cash collected on behalf of the entities by GE as servicer, which are eliminated in consolidation. Such receivables
provide the cash to repay the entities’ liabilities. If these intercompany receivables were included in the table above, assets would be higher. In addition, other assets,
borrowings and other liabilities exclude intercompany balances that are eliminated in consolidation.
Total revenues from our consolidated VIEs were $7,127 mil-
lion, $6,326 million and $7,122 million in 2012, 2011 and 2010,
respectively. Related expenses consisted primarily of provisions
for losses of $1,171 million, $1,146 million and $1,596 million in
2012, 2011 and 2010, respectively, and interest and other financial
charges of $541 million, $594 million and $767 million in 2012,
2011 and 2010, respectively. These amounts do not include
intercompany revenues and costs, principally fees and interest
between GE and the VIEs, which are eliminated in consolidation.
Investments in Unconsolidated Variable Interest Entities
Our involvement with unconsolidated VIEs consists of the fol-
lowing activities: assisting in the formation and financing of the
entity, providing recourse and/or liquidity support, servicing
the assets and receiving variable fees for services provided.
We are not required to consolidate these entities because the
nature of our involvement with the activities of the VIEs does
not give us power over decisions that significantly affect their
economic performance.