GE 2012 Annual Report Download - page 71
Download and view the complete annual report
Please find page 71 of the 2012 GE annual report below. You can navigate through the pages in the report by either clicking on the pages listed below, or by using the keyword search tool below to find specific information within the annual report.-
 1
1 -
2
-
3
-
4
-
5
-
6
-
7
-
8
-
9
-
10
-
11
-
12
-
13
-
14
-
15
-
16
-
17
-
18
-
19
-
20
-
21
-
22
-
23
-
24
-
25
-
26
-
27
-
28
-
29
-
30
-
31
-
32
-
33
-
34
-
35
-
36
-
37
-
38
-
39
-
40
-
41
-
42
-
43
-
44
-
45
-
46
-
47
-
48
-
49
-
50
-
51
-
52
-
53
-
54
-
55
-
56
-
57
-
58
-
59
-
60
-
 61
61 -
 62
62 -
 63
63 -
 64
64 -
 65
65 -
 66
66 -
 67
67 -
 68
68 -
 69
69 -
 70
70 -
 71
71 -
 72
72 -
 73
73 -
 74
74 -
 75
75 -
 76
76 -
 77
77 -
 78
78 -
 79
79 -
 80
80 -
 81
81 -
82
-
83
-
84
-
85
-
86
-
87
-
88
-
89
-
90
-
91
-
92
-
93
-
94
-
95
-
96
-
97
-
98
-
99
-
100
-
101
-
102
-
103
-
104
-
105
-
106
-
107
-
108
-
109
-
110
-
111
-
112
-
113
-
114
-
115
-
116
-
117
-
118
-
119
-
120
-
121
-
122
-
123
-
124
-
125
-
126
-
127
-
128
-
129
-
130
-
131
-
132
-
133
-
134
-
135
-
136
-
137
-
138
-
139
-
140
-
141
-
142
-
143
-
144
-
145
-
146
-
147
-
148
-
149
-
150
 |
 |

GE 2012 ANNUAL REPORT 69
management’s discussion and analsis
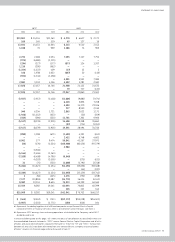
Selected Financial Data
The following table provides key information for Consolidated, GE and GECC.
(Dollars in millions; per-share amounts in dollars) 2012 2011 2010 2009 2008
GENERAL ELECTRIC COMPANY AND CONSOLIDATED AFFILIATES
Revenues and other income $147,359 $147,288 $149,567 $154,396 $179,769
Earnings from continuing operations attributable to the Company 14,679 14,227 12,613 10,881 17,786
Earnings (loss) from discontinued operations, net of taxes,
attributable to the Company (1,038) (76) (969) 144 (376)
Net earnings attributable to the Company 13,641 14,151 11,644 11,025 17,410
Dividends declared (a) 7,372 7,498 5,212 6,785 12,649
Return on average GE shareowners’ equity (b) 12.1 % 12.1 % 12.3 % 11.7 % 17.1 %
Per common share
Earnings from continuing operations—diluted $ 1.39 $ 1.24 $ 1.15 $ 0.99 $ 1.75
Earnings (loss) from discontinued operations—diluted (0.10) (0.01) (0.09) 0.01 (0.04)
Net earnings—diluted 1.29 1.23 1.06 1.01 1.72
Earnings from continuing operations—basic 1.39 1.24 1.15 0.99 1.76
Earnings (loss) from discontinued operations—basic (0.10) (0.01) (0.09) 0.01 (0.04)
Net earnings—basic 1.29 1.24 1.06 1.01 1.72
Dividends declared 0.70 0.61 0.46 0.61 1.24
Stock price range 23.18–18.02 21.65–14.02 19.70–13.75 17.52–5.87 38.52–12.58
Year-end closing stock price 20.99 17.91 18.29 15.13 16.20
Cash and equivalents 77,356 84,501 78,943 70,479 48,378
Total assets of continuing operations 684,193 716,468 735,431 756,897 773,191
Total assets 685,328 718,189 748,491 782,714 798,398
Long-term borrowings 236,084 243,459 293,323 336,172 320,522
Common shares outstanding—average (in thousands) 10,522,922 10,591,146 10,661,078 10,613,717 10,079,923
Common shareowner accounts—average 537,000 570,000 588,000 605,000 604,000
Employees at year end (c)
United States 134,000 131,000 121,000 122,000 139,000
Other countries 171,000 170,000 152,000 168,000 169,000
Total employees (c) 305,000 301,000 273,000 290,000 308,000
GE DATA
Short-term borrowings $ 6,041 $ 2,184 $ 456 $ 504 $ 2,375
Long-term borrowings 11,428 9,405 9,656 11,681 9,827
Noncontrolling interests 777 1,006 4,098 5,797 6,678
GE shareowners’ equity 123,026 116,438 118,936 117,291 104,665
Total capital invested $141,272 $129,033 $133,146 $135,273 $123,545
Return on average total capital invested (b) 11.7 % 11.7 % 12.0 % 10.7 % 15.7 %
Borrowings as a percentage of total capital invested (b) 12.4 % 9.0 % 7.6 % 9.0 % 9.9 %
Working capital (b) $ 1,031 $ (10) $ (1,618 ) $ (1,596 ) $ 3,904
GECC DATA
Revenues $ 46,039 $ 49,068 $ 49,856 $ 51,776 $ 68,541
Earnings from continuing operations attributable to GECC 7,401 6,584 3,120 1,253 7,470
Earnings (loss) from discontinued operations, net of taxes,
attributable to GECC (1,186) (74) (965) 162 (415)
Net earnings attributable to GECC 6,215 6,510 2,155 1,415 7,055
Net earnings attributable to GECC common shareowner 6,092 6,510 2,155 1,415 7,055
GECC shareowners’ equity 81,890 77,110 68,984 70,833 53,279
Total borrowings and bank deposits 397,300 443,097 470,520 493,324 512,745
Ratio of debt to equity at GECC 4.85:1 (d) 5.75:1 (d) 6.82:1 (d) 6.96:1 9.62:1
Total assets $539,223 $584,536 $605,255 $650,372 $661,009
Transactions between GE and GECC have been eliminated from the consolidated information.
(a) Included $1,031 million of preferred stock dividends ($806 million related to our preferred stock redemption) in 2011, $300 million in both 2010 and 2009 and $75 million in 2008.
(b) Indicates terms are defined in the Glossary.
(c) Excludes NBC Universal employees of 14,600, 14,000 and 15,000 in 2010, 2009 and 2008, respectively.
(d) Ratios of 3.66:1, 4.23:1 and 5.25:1 for 2012, 2011 and 2010, respectively, net of cash and equivalents and with classification of hybrid debt as equity.