GE 2012 Annual Report Download - page 109
Download and view the complete annual report
Please find page 109 of the 2012 GE annual report below. You can navigate through the pages in the report by either clicking on the pages listed below, or by using the keyword search tool below to find specific information within the annual report.-
 1
1 -
2
-
3
-
4
-
5
-
6
-
7
-
8
-
9
-
10
-
11
-
12
-
13
-
14
-
15
-
16
-
17
-
18
-
19
-
20
-
21
-
22
-
23
-
24
-
25
-
26
-
27
-
28
-
29
-
30
-
31
-
32
-
33
-
34
-
35
-
36
-
37
-
38
-
39
-
40
-
41
-
42
-
43
-
44
-
45
-
46
-
47
-
48
-
49
-
50
-
51
-
52
-
53
-
54
-
55
-
56
-
57
-
58
-
59
-
60
-
61
-
62
-
63
-
64
-
65
-
66
-
67
-
68
-
69
-
70
-
71
-
72
-
73
-
74
-
75
-
76
-
77
-
78
-
79
-
80
-
81
-
82
-
83
-
84
-
85
-
86
-
87
-
88
-
89
-
90
-
91
-
92
-
93
-
94
-
95
-
96
-
97
-
98
-
 99
99 -
 100
100 -
 101
101 -
 102
102 -
 103
103 -
 104
104 -
 105
105 -
 106
106 -
 107
107 -
 108
108 -
 109
109 -
 110
110 -
 111
111 -
 112
112 -
 113
113 -
 114
114 -
 115
115 -
 116
116 -
 117
117 -
 118
118 -
 119
119 -
120
-
121
-
122
-
123
-
124
-
125
-
126
-
127
-
128
-
129
-
130
-
131
-
132
-
133
-
134
-
135
-
136
-
137
-
138
-
139
-
140
-
141
-
142
-
143
-
144
-
145
-
146
-
147
-
148
-
149
-
150
 |
 |

GE 2012 ANNUAL REPORT 107
notes to consolidated financial statements
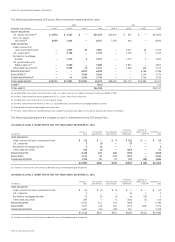
In 2013, we estimate that we will amortize $395 million of prior
service cost and $15 million of net actuarial loss from share-
owners’ equity into retiree benefit plans cost. Comparable
amortized amounts in 2012 were $518 million of prior service
cost and $32 million of net actuarial loss.
ESTIMATED FUTURE BENEFIT PAYMENTS
(In millions) 2013 2014 2015 2016 2017
2018–
2022
$780 $785 $785 $785 $785 $3,800
Postretirement Benefit Plans
2012 COST OF POSTRETIREMENT BENEFIT PLANS AND CHANGES IN
OTHER COMPREHENSIVE INCOME
Total
postretirement
(In millions) benefit plans
Principal
pension
plans
Other
pension
plans
Retiree
benefit
plans
Cost of postretirement
benefit plans $ 5,452 $ 3,798 $ 568 $ 1,086
Changes in other
comprehensive income
Prior service cost (credit)—
current year (838) — (6) (832)
Net actuarial loss (gain)—
current year 1,804 935 954 (85)
Net curtailment/
settlement (297) — — (297)
Prior service cost
amortization (805) (279) (8) (518)
Net actuarial loss
amortization (3,733) (3,421) (280) (32)
Total changes in other
comprehensive income (3,869) (2,765) 660 (1,764)
Cost of postretirement
benefit plans and
changes in other
comprehensive income $ 1,583 $ 1,033 $1,228 $ (678)
Note 13.
All Other Liabilities
This caption includes liabilities for various items including non-
current compensation and benefits, deferred income, interest
on tax liabilities, unrecognized tax benefits, environmental
remediation, asset retirement obligations, derivative instruments,
product warranties and a variety of sundry items.
Accruals for non-current compensation and benefits amounted
to $39,460 million and $39,430 million at December 31, 2012 and
2011, respectively. These amounts include postretirement benefits,
pension accruals, and other compensation and benefit accruals
such as deferred incentive compensation. See Note 12.
We are involved in numerous remediation actions to clean
up hazardous wastes as required by federal and state laws.
Liabilities for remediation costs exclude possible insurance
recoveries and, when dates and amounts of such costs are not
known, are not discounted. When there appears to be a range of
possible costs with equal likelihood, liabilities are based on the
low end of such range. It is reasonably possible that our envi-
ronmental remediation exposure will exceed amounts accrued.
However, due to uncertainties about the status of laws, regula-
tions, technology and information related to individual sites, such
amounts are not reasonably estimable. Total reserves related
to environmental remediation, including asbestos claims, were
$2,988 million at December 31, 2012.
Note 14.
Income Taxes
PROVISION FOR INCOME TAXES
(In millions) 2012 2011 2010
GE
Current tax expense $ 2,307 $5,166 $ 2,401
Deferred tax expense (benefit)
from temporary differences (294) (327) (377)
2,013 4,839 2,024
GECC
Current tax expense (benefit) 1,368 775 (2,292)
Deferred tax expense (benefit)
from temporary differences (877) 124 1,307
491 899 (985)
CONSOLIDATED
Current tax expense 3,675 5,941 109
Deferred tax expense (benefit)
from temporary differences (1,171) (203) 930
Total $ 2,504 $5,738 $ 1,039
GE and GECC file a consolidated U.S. federal income tax return.
This enables GE to use GECC tax deductions and credits to
reduce the tax that otherwise would have been payable by GE.
The GECC effective tax rate for each period reflects the benefit
of these tax reductions in the consolidated return. GE makes
cash payments to GECC for these tax reductions at the time
GE’s tax payments are due. The effect of GECC on the amount
of the consolidated tax liability from the formation of the NBCU
joint venture will be settled in cash no later than when GECC tax
deductions and credits otherwise would have reduced the liabil-
ity of the group absent the tax on joint venture formation.
Consolidated U.S. earnings (loss) from continuing operations
before income taxes were $8,430 million in 2012, $10,116 million
in 2011 and $5,458 million in 2010. The corresponding amounts
for non-U.S.-based operations were $8,976 million in 2012,
$10,141 million in 2011 and $8,729 million in 2010.
Consolidated current tax expense (benefit) includes amounts
applicable to U.S. federal income taxes of $651 million in 2012,
$1,037 million in 2011 and $(3,022) million in 2010, including the
benefit from GECC deductions and credits applied against GE’s
current U.S. tax expense. Consolidated current tax expense
amounts applicable to non-U.S. jurisdictions were $2,895 million,
$4,657 million and $3,132 million in 2012, 2011 and 2010, respec-
tively. Consolidated deferred taxes related to U.S. federal income
taxes were an expense (benefit) of $(414) million, $1,529 mil-
lion and $1,994 million in 2012, 2011 and 2010, respectively, and
amounts applicable to non-U.S. jurisdictions of an expense (ben-
efit) of $(792) million, $(2,076) million and $(1,178) million in 2012,
2011 and 2010, respectively.