GE 2012 Annual Report Download - page 119
Download and view the complete annual report
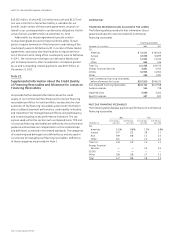
Please find page 119 of the 2012 GE annual report below. You can navigate through the pages in the report by either clicking on the pages listed below, or by using the keyword search tool below to find specific information within the annual report.-
 1
1 -
2
-
3
-
4
-
5
-
6
-
7
-
8
-
9
-
10
-
11
-
12
-
13
-
14
-
15
-
16
-
17
-
18
-
19
-
20
-
21
-
22
-
23
-
24
-
25
-
26
-
27
-
28
-
29
-
30
-
31
-
32
-
33
-
34
-
35
-
36
-
37
-
38
-
39
-
40
-
41
-
42
-
43
-
44
-
45
-
46
-
47
-
48
-
49
-
50
-
51
-
52
-
53
-
54
-
55
-
56
-
57
-
58
-
59
-
60
-
61
-
62
-
63
-
64
-
65
-
66
-
67
-
68
-
69
-
70
-
71
-
72
-
73
-
74
-
75
-
76
-
77
-
78
-
79
-
80
-
81
-
82
-
83
-
84
-
85
-
86
-
87
-
88
-
89
-
90
-
91
-
92
-
93
-
94
-
95
-
96
-
97
-
98
-
99
-
100
-
101
-
102
-
103
-
104
-
105
-
106
-
107
-
108
-
 109
109 -
 110
110 -
 111
111 -
 112
112 -
 113
113 -
 114
114 -
 115
115 -
 116
116 -
 117
117 -
 118
118 -
 119
119 -
 120
120 -
 121
121 -
 122
122 -
 123
123 -
 124
124 -
 125
125 -
 126
126 -
 127
127 -
 128
128 -
 129
129 -
130
-
131
-
132
-
133
-
134
-
135
-
136
-
137
-
138
-
139
-
140
-
141
-
142
-
143
-
144
-
145
-
146
-
147
-
148
-
149
-
150
 |
 |

GE 2012 ANNUAL REPORT 117
notes to consolidated financial statements
Note 21.
Fair Value Measurements
For a description of how we estimate fair value, see Note 1.
The following tables present our assets and liabilities measured at fair value on a recurring basis. Included in the tables are investment
securities primarily supporting obligations to annuitants and policyholders in our run-off insurance operations and supporting obligations
to holders of GICs in Trinity (which ceased issuing new investment contracts beginning in the first quarter of 2010), investment securities
held at our treasury operations and investments held in our CLL business collateralized by senior secured loans of high-quality, middle-
market companies in a variety of industries. Such securities are mainly investment grade.
(In millions) Level 1 (a) Level 2 (a) Level 3
Netting
adjustment (b) Net balance
DECEMBER 31, 2012
ASSETS
Investment securities
Debt
U.S. corporate $ — $20,580 $ 3,591 $ — $24,171
State and municipal — 4,469 77 — 4,546
Residential mortgage-backed — 2,162 100 — 2,262
Commercial mortgage-backed — 3,088 6 — 3,094
Asset-backed
(c) — 715 5,023 — 5,738
Corporate—non-U.S. 71 1,132 1,218 — 2,421
Government—non-U.S. 702 1,019 42 — 1,763
U.S. government and federal agency — 3,288 277 — 3,565
Retained interests — — 83 — 83
Equity
Available-for-sale 590 16 13 — 619
Trading 248 — — — 248
Derivatives (d) — 11,432 434 (7,926) 3,940
Other (e) 35 — 799 — 834
Total $1,646 $47,901 $11,663 $(7,926) $53,284
LIABILITIES
Derivatives $ — $ 3,434 $ 20 $(3,177) $ 277
Other (f) — 908 — — 908
Total $ — $ 4,342 $ 20 $(3,177) $ 1,185
DECEMBER 31, 2011
ASSETS
Investment securities
Debt
U.S. corporate $ — $20,535 $ 3,235 $ — $23,770
State and municipal — 3,157 77 — 3,234
Residential mortgage-backed — 2,568 41 — 2,609
Commercial mortgage-backed — 2,824 4 — 2,828
Asset-backed
(c) — 930 4,040 — 4,970
Corporate—non-U.S. 71 1,058 1,204 — 2,333
Government—non-U.S. 1,003 1,444 84 — 2,531
U.S. government and federal agency — 3,805 253 — 4,058
Retained interests — — 35 — 35
Equity
Available-for-sale 730 18 17 — 765
Trading 241 — — — 241
Derivatives (d) — 15,252 393 (5,604) 10,041
Other (e) — — 817 — 817
Total $2,045 $51,591 $10,200 $(5,604) $58,232
LIABILITIES
Derivatives $ — $ 5,010 $ 27 $(4,308) $ 729
Other (f) — 863 — — 863
Total $ — $ 5,873 $ 27 $(4,308) $ 1,592
(a) There were no securities transferred between Level 1 and Level 2 during 2012.
(b) The netting of derivative receivables and payables (including the effects of any collateral posted or received) is permitted when a legally enforceable master netting
agreement exists.
(c) Includes investments in our CLL business in asset-backed securities collateralized by senior secured loans of high-quality, middle-market companies in a variety of industries.
(d) The fair value of derivatives included an adjustment for non-performance risk. The cumulative adjustment was a gain (loss) of $(15) million at December 31, 2012 and
$(13) million at December 31, 2011. See Note 22 for additional information on the composition of our derivative portfolio.
(e) Included private equity investments and loans designated under the fair value option.
(f) Primarily represented the liability associated with certain of our deferred incentive compensation plans.