GE 2012 Annual Report Download - page 108
Download and view the complete annual report
Please find page 108 of the 2012 GE annual report below. You can navigate through the pages in the report by either clicking on the pages listed below, or by using the keyword search tool below to find specific information within the annual report.-
 1
1 -
2
-
3
-
4
-
5
-
6
-
7
-
8
-
9
-
10
-
11
-
12
-
13
-
14
-
15
-
16
-
17
-
18
-
19
-
20
-
21
-
22
-
23
-
24
-
25
-
26
-
27
-
28
-
29
-
30
-
31
-
32
-
33
-
34
-
35
-
36
-
37
-
38
-
39
-
40
-
41
-
42
-
43
-
44
-
45
-
46
-
47
-
48
-
49
-
50
-
51
-
52
-
53
-
54
-
55
-
56
-
57
-
58
-
59
-
60
-
61
-
62
-
63
-
64
-
65
-
66
-
67
-
68
-
69
-
70
-
71
-
72
-
73
-
74
-
75
-
76
-
77
-
78
-
79
-
80
-
81
-
82
-
83
-
84
-
85
-
86
-
87
-
88
-
89
-
90
-
91
-
92
-
93
-
94
-
95
-
96
-
97
-
 98
98 -
 99
99 -
 100
100 -
 101
101 -
 102
102 -
 103
103 -
 104
104 -
 105
105 -
 106
106 -
 107
107 -
 108
108 -
 109
109 -
 110
110 -
 111
111 -
 112
112 -
 113
113 -
 114
114 -
 115
115 -
 116
116 -
 117
117 -
 118
118 -
119
-
120
-
121
-
122
-
123
-
124
-
125
-
126
-
127
-
128
-
129
-
130
-
131
-
132
-
133
-
134
-
135
-
136
-
137
-
138
-
139
-
140
-
141
-
142
-
143
-
144
-
145
-
146
-
147
-
148
-
149
-
150
 |
 |

106 GE 2012 ANNUAL REPORT
notes to consolidated financial statements
by asset class and diversification across classes to determine
expected overall portfolio results given current and target allo-
cations. Based on our analysis of future expectations of asset
performance, past return results, our current and target asset
allocations as well as a shorter time horizon for retiree life plan
assets, we have assumed a 7.0% long-term expected return on
those assets for cost recognition in 2013. We apply our expected
rate of return to a market-related value of assets, which stabilizes
variability in the amounts to which we apply that expected return.
We amortize experience gains and losses, as well as the
effects of changes in actuarial assumptions and plan provi-
sions, over a period no longer than the average future service
of employees.
FUNDING POLICY. We fund retiree health benefits on a pay-as-
you-go basis. We expect to contribute approximately $600 million
in 2013 to fund such benefits. We fund the retiree life insurance
trust at our discretion.
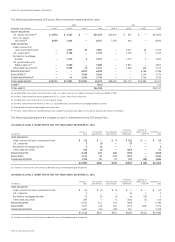
Changes in the accumulated postretirement benefit obligation
for retiree benefit plans follow.
ACCUMULATED POSTRETIREMENT BENEFIT OBLIGATION (APBO)
(In millions) 2012 2011
Balance at January 1 $13,056 $12,010
Service cost for benefits earned 219 216
Interest cost on benefit obligations 491 604
Participant contributions 54 55
Plan amendments (832) 25
Actuarial loss (gain) (60) 911 (a)
Benefits paid (758) (765)
Net curtailment/settlement (366) —
Balance at December 31 (b) $11,804 $13,056
(a) Primarily associated with discount rate change.
(b) The APBO for the retiree health plans was $9,218 million and $10,286 million at
year-end 2012 and 2011, respectively.
A one percentage point change in the assumed healthcare cost
trend rate would have the following effects.
(In millions) 1% Increase 1% Decrease
APBO at December 31, 2012 $1,017 $(860)
Service and interest cost in 2012 76 (63)
PLAN ASSETS
The fair value of the classes of retiree benefit plans’ investments
is presented below. The inputs and valuation techniques used
to measure the fair value of assets are consistently applied and
described in Note 1.
FAIR VALUE OF PLAN ASSETS
(In millions) 2012 2011
Balance at January 1 $1,004 $1,125
Actual gain on plan assets 98 15
Employer contributions 548 574
Participant contributions 54 55
Benefits paid (758) (765)
Balance at December 31 $ 946 $1,004
ASSET ALLOCATION
December 31
2012 Target
allocation
2012 Actual
allocation
Equity securities 35–75% (a) 35% (b)
Debt securities (including cash equivalents) 11–41 40
Private equities 3–13 17
Real estate 2–12 6
Other 0–10 2
(a) Target allocations were 18–38% for U.S. equity securities and 17–37% for
non-U.S. equity securities.
(b) Actual allocations were 22% for U.S. equity securities and 13% for non-U.S.
equity securities.
Plan fiduciaries set investment policies and strategies for the
trust and oversee its investment allocation, which includes
selecting investment managers and setting long-term strategic
targets. The primary strategic investment objectives are balanc-
ing investment risk and return and monitoring the plan’s liquidity
position in order to meet the near-term benefit payment and
other cash needs. Target allocation percentages are established
at an asset class level by plan fiduciaries. Target allocation ranges
are guidelines, not limitations, and occasionally plan fiduciaries
will approve allocations above or below a target range.
Trust assets invested in short-term securities must generally
be invested in securities rated A-1/P-1 or better, except for 15%
of such securities that may be rated A-2/P-2 and other short-term
securities as may be approved by the plan fiduciaries. According
to statute, the aggregate holdings of all qualifying employer
securities (e.g., GE common stock) and qualifying employer real
property may not exceed 10% of the fair value of trust assets at
the time of purchase. GE securities represented 5.8% and 4.7% of
trust assets at year-end 2012 and 2011, respectively.
Retiree life plan assets were $946 million and $1,004 mil-
lion at December 31, 2012 and 2011, respectively. Equity and
debt securities amounting to $741 million and $760 million rep-
resented approximately 75% and 74% of total investments at
December 31, 2012 and 2011, respectively. The plans’ invest-
ments were classified as 28% Level 1, 47% Level 2 and 25%
Level 3 at December 31, 2012. The plans’ investments were classi-
fied as 32% Level 1, 42% Level 2 and 26% Level 3 at December 31,
2011. The changes in Level 3 investments were insignificant for
the years ended December 31, 2012 and 2011.
RETIREE BENEFIT ASSET (LIABILITY)
December 31 (In millions) 2012 2011
Funded status (a) $(10,858) $(12,052)
Liability recorded in the Statement
of Financial Position
Retiree health plans
Due within one year $ (589) $ (602)
Due after one year (8,629) (9,684)
Retiree life plans (1,640) (1,766)
Net liability recognized $(10,858) $(12,052)
Amounts recorded in shareowners’
equity (unamortized)
Prior service cost $ 1,356 $ 2,901
Net actuarial loss 182 401
Total $ 1,538 $ 3,302
(a) Fair value of assets less APBO, as shown in the preceding tables.