GE 2012 Annual Report Download - page 72
Download and view the complete annual report
Please find page 72 of the 2012 GE annual report below. You can navigate through the pages in the report by either clicking on the pages listed below, or by using the keyword search tool below to find specific information within the annual report.-
 1
1 -
2
-
3
-
4
-
5
-
6
-
7
-
8
-
9
-
10
-
11
-
12
-
13
-
14
-
15
-
16
-
17
-
18
-
19
-
20
-
21
-
22
-
23
-
24
-
25
-
26
-
27
-
28
-
29
-
30
-
31
-
32
-
33
-
34
-
35
-
36
-
37
-
38
-
39
-
40
-
41
-
42
-
43
-
44
-
45
-
46
-
47
-
48
-
49
-
50
-
51
-
52
-
53
-
54
-
55
-
56
-
57
-
58
-
59
-
60
-
61
-
 62
62 -
 63
63 -
 64
64 -
 65
65 -
 66
66 -
 67
67 -
 68
68 -
 69
69 -
 70
70 -
 71
71 -
 72
72 -
 73
73 -
 74
74 -
 75
75 -
 76
76 -
 77
77 -
 78
78 -
 79
79 -
 80
80 -
 81
81 -
 82
82 -
83
-
84
-
85
-
86
-
87
-
88
-
89
-
90
-
91
-
92
-
93
-
94
-
95
-
96
-
97
-
98
-
99
-
100
-
101
-
102
-
103
-
104
-
105
-
106
-
107
-
108
-
109
-
110
-
111
-
112
-
113
-
114
-
115
-
116
-
117
-
118
-
119
-
120
-
121
-
122
-
123
-
124
-
125
-
126
-
127
-
128
-
129
-
130
-
131
-
132
-
133
-
134
-
135
-
136
-
137
-
138
-
139
-
140
-
141
-
142
-
143
-
144
-
145
-
146
-
147
-
148
-
149
-
150
 |
 |

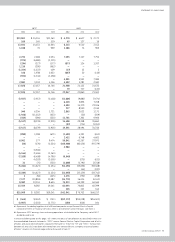
70 GE 2012 ANNUAL REPORT
audited financial statements
Statement of Earnings
General Electric Company
and consolidated affiliates
For the years ended December 31 (In millions; per-share amounts in dollars) 2012 2011 2010
REVENUES AND OTHER INCOME
Sales of goods $ 72,991 $ 66,875 $ 60,811
Sales of services 27,158 27,648 39,625
Other income (Note 17) 2,563 5,064 1,151
GECC earnings from continuing operations — — —
GECC revenues from services (Note 18) 44,647 47,701 47,980
Total revenues and other income 147,359 147,288 149,567
COSTS AND EXPENSES (Note 19)
Cost of goods sold 56,785 51,455 45,998
Cost of services sold 17,525 16,823 25,715
Interest and other financial charges 12,508 14,528 15,537
Investment contracts, insurance losses and insurance annuity benefits 2,857 2,912 3,012
Provision for losses on financing receivables (Notes 6 and 23) 3,891 3,951 7,085
Other costs and expenses 36,387 37,362 38,033
Total costs and expenses 129,953 127,031 135,380
EARNINGS FROM CONTINUING OPERATIONS BEFORE INCOME TAXES 17,406 20,257 14,187
Benefit (provision) for income taxes (Note 14) (2,504) (5,738) (1,039)
EARNINGS FROM CONTINUING OPERATIONS 14,902 14,519 13,148
Earnings (loss) from discontinued operations, net of taxes (Note 2) (1,038) (76) (969)
NET EARNINGS 13,864 14,443 12,179
Less net earnings attributable to noncontrolling interests 223 292 535
NET EARNINGS ATTRIBUTABLE TO THE COMPANY 13,641 14,151 11,644
Preferred stock dividends declared — (1,031) (300)
NET EARNINGS ATTRIBUTABLE TO GE COMMON SHAREOWNERS $ 13,641 $ 13,120 $ 11,344
AMOUNTS ATTRIBUTABLE TO THE COMPANY
Earnings from continuing operations $ 14,679 $ 14,227 $ 12,613
Earnings (loss) from discontinued operations, net of taxes (1,038) (76) (969)
NET EARNINGS ATTRIBUTABLE TO THE COMPANY $ 13,641 $ 14,151 $ 11,644
PER-SHARE AMOUNTS (Note 20)
Earnings from continuing operations
Diluted earnings per share $ 1.39 $ 1.24 $ 1.15
Basic earnings per share 1.39 1.24 1.15
Net earnings
Diluted earnings per share 1.29 1.23 1.06
Basic earnings per share 1.29 1.24 1.06
DIVIDENDS DECLARED PER SHARE 0.70 0.61 0.46
See Note 3 for other-than-temporary impairment amounts.
See accompanying notes.
Consolidated Statement of Comprehensive Income
For the years ended December 31 (In millions) 2012 2011 2010
NET EARNINGS $13,864 $14,443 $12,179
Less: net earnings (loss) attributable to noncontrolling interests 223 292 535
NET EARNINGS ATTRIBUTABLE TO GE $13,641 $14,151 $11,644
Other comprehensive income (loss)
Investment securities $ 705 $ 608 $ 16
Currency translation adjustments 300 180 (3,876)
Cash flow hedges 453 118 505
Benefit plans 2,299 (7,040) 1,068
OTHER COMPREHENSIVE INCOME (LOSS) 3,757 (6,134) (2,287)
Less: other comprehensive income (loss) attributable to noncontrolling interests 13 (15) 38
OTHER COMPREHENSIVE INCOME (LOSS) ATTRIBUTABLE TO GE $ 3,744 $ (6,119) $ (2,325)
Comprehensive income $17,621 $ 8,309 $ 9,892
Less: comprehensive income attributable to noncontrolling interests 236 277 573
COMPREHENSIVE INCOME ATTRIBUTABLE TO GE $17,385 $ 8,032 $ 9,319
Amounts presented net of taxes. See Note 15 for further information about other comprehensive income and noncontrolling interests.
See accompanying notes.