GE 2012 Annual Report Download - page 127
Download and view the complete annual report
Please find page 127 of the 2012 GE annual report below. You can navigate through the pages in the report by either clicking on the pages listed below, or by using the keyword search tool below to find specific information within the annual report.-
 1
1 -
2
-
3
-
4
-
5
-
6
-
7
-
8
-
9
-
10
-
11
-
12
-
13
-
14
-
15
-
16
-
17
-
18
-
19
-
20
-
21
-
22
-
23
-
24
-
25
-
26
-
27
-
28
-
29
-
30
-
31
-
32
-
33
-
34
-
35
-
36
-
37
-
38
-
39
-
40
-
41
-
42
-
43
-
44
-
45
-
46
-
47
-
48
-
49
-
50
-
51
-
52
-
53
-
54
-
55
-
56
-
57
-
58
-
59
-
60
-
61
-
62
-
63
-
64
-
65
-
66
-
67
-
68
-
69
-
70
-
71
-
72
-
73
-
74
-
75
-
76
-
77
-
78
-
79
-
80
-
81
-
82
-
83
-
84
-
85
-
86
-
87
-
88
-
89
-
90
-
91
-
92
-
93
-
94
-
95
-
96
-
97
-
98
-
99
-
100
-
101
-
102
-
103
-
104
-
105
-
106
-
107
-
108
-
109
-
110
-
111
-
112
-
113
-
114
-
115
-
116
-
 117
117 -
 118
118 -
 119
119 -
 120
120 -
 121
121 -
 122
122 -
 123
123 -
 124
124 -
 125
125 -
 126
126 -
 127
127 -
 128
128 -
 129
129 -
 130
130 -
 131
131 -
 132
132 -
 133
133 -
 134
134 -
 135
135 -
 136
136 -
 137
137 -
138
-
139
-
140
-
141
-
142
-
143
-
144
-
145
-
146
-
147
-
148
-
149
-
150
 |
 |

GE 2012 ANNUAL REPORT 125
notes to consolidated financial statements
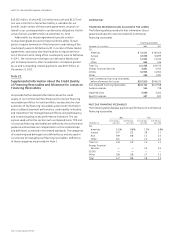
NONACCRUAL FINANCING RECEIVABLES
The following table provides further information about Commercial financing receivables that are classified as nonaccrual. Of our
$4,166 million and $4,718 million of nonaccrual financing receivables at December 31, 2012 and 2011, respectively, $2,647 million and
$1,227 million are currently paying in accordance with their contractual terms, respectively.
Nonaccrual financing
receivables
Nonearning financing
receivables
December 31 (Dollars in millions) 2012 2011 2012 2011
CLL
Americas $1,951 $2,417 $1,333 $1,862
Europe 1,740 1,599 1,299 1,167
Asia 395 428 193 269
Other 52 68 52 11
Total CLL 4,138 4,512 2,877 3,309
Energy Financial Services —22 —22
GECAS 369 —55
Other 25 115 13 65
Total $4,166 $4,718 $2,890 $3,451
Allowance for losses percentage 25.0% 32.4% 36.0% 44.3%
IMPAIRED LOANS
The following table provides information about loans classified as impaired and specific reserves related to Commercial.
With no specific allowance With a specific allowance
December 31 (In millions)
Recorded
investment
in loans
Unpaid
principal
balance
Average
investment
in loans
Recorded
investment
in loans
Unpaid
principal
balance
Associated
allowance
Average
investment
in loans
2012
CLL
Americas $2,487 $2,927 $2,535 $ 557 $ 681 $178 $ 987
Europe 1,131 1,901 1,009 643 978 278 805
Asia 62 64 62 109 120 23 134
Other — — 43 52 68 6 16
Total CLL 3,680 4,892 3,649 1,361 1,847 485 1,942
Energy Financial Services —— 2——— 7
GECAS ——1733—5
Other 17 28 26 8 8 2 40
Total $3,697 $4,920 $3,694 $1,372 $1,858 $487 $1,994
2011
CLL
Americas $2,136 $2,219 $2,128 $1,367 $1,415 $425 $1,468
Europe 936 1,060 1,001 730 717 263 602
Asia 85 83 94 156 128 84 214
Other 5458131111 2 5
Total CLL 3,211 3,420 3,236 2,264 2,271 774 2,289
Energy Financial Services 4 4 20 18 18 9 87
GECAS 28 28 59 — — — 11
Other 62636775752997
Total $3,305 $3,515 $3,382 $2,357 $2,364 $812 $2,484
We recognized $253 million and $193 million of interest income,
including $92 million and $59 million on a cash basis, for the years
ended December 31, 2012 and 2011, respectively, principally
in our CLL Americas business. The total average investment in
impaired loans for the years ended December 31, 2012 and 2011
was $5,688 million and $5,866 million, respectively.
Impaired loans classified as TDRs in our CLL business were
$3,872 million and $3,642 million at December 31, 2012 and 2011,
respectively, and were primarily attributable to CLL Americas
($2,577 million and $2,746 million, respectively). For the year
ended December 31, 2012, we modified $2,935 million of loans
classified as TDRs, primarily in CLL Americas ($1,739 million)
and CLL EMEA ($992 million). Changes to these loans primar-
ily included debt-to-equity exchange, extensions, interest-only
payment periods and forbearance or other actions, which are in
addition to, or sometimes in lieu of, fees and rate increases. Of
our $2,935 million of modifications classified as TDRs during 2012,
$217 million have subsequently experienced a payment default
in 2012. Of our $1,856 million of modifications classified as TDRs
during 2011, $101 million have subsequently experienced a pay-
ment default in 2011.