GE 2012 Annual Report Download - page 111
Download and view the complete annual report
Please find page 111 of the 2012 GE annual report below. You can navigate through the pages in the report by either clicking on the pages listed below, or by using the keyword search tool below to find specific information within the annual report.-
 1
1 -
2
-
3
-
4
-
5
-
6
-
7
-
8
-
9
-
10
-
11
-
12
-
13
-
14
-
15
-
16
-
17
-
18
-
19
-
20
-
21
-
22
-
23
-
24
-
25
-
26
-
27
-
28
-
29
-
30
-
31
-
32
-
33
-
34
-
35
-
36
-
37
-
38
-
39
-
40
-
41
-
42
-
43
-
44
-
45
-
46
-
47
-
48
-
49
-
50
-
51
-
52
-
53
-
54
-
55
-
56
-
57
-
58
-
59
-
60
-
61
-
62
-
63
-
64
-
65
-
66
-
67
-
68
-
69
-
70
-
71
-
72
-
73
-
74
-
75
-
76
-
77
-
78
-
79
-
80
-
81
-
82
-
83
-
84
-
85
-
86
-
87
-
88
-
89
-
90
-
91
-
92
-
93
-
94
-
95
-
96
-
97
-
98
-
99
-
100
-
 101
101 -
 102
102 -
 103
103 -
 104
104 -
 105
105 -
 106
106 -
 107
107 -
 108
108 -
 109
109 -
 110
110 -
 111
111 -
 112
112 -
 113
113 -
 114
114 -
 115
115 -
 116
116 -
 117
117 -
 118
118 -
 119
119 -
 120
120 -
 121
121 -
122
-
123
-
124
-
125
-
126
-
127
-
128
-
129
-
130
-
131
-
132
-
133
-
134
-
135
-
136
-
137
-
138
-
139
-
140
-
141
-
142
-
143
-
144
-
145
-
146
-
147
-
148
-
149
-
150
 |
 |

GE 2012 ANNUAL REPORT 109
notes to consolidated financial statements
A reconciliation of the U.S. federal statutory income tax rate to the actual income tax rate is provided below.
RECONCILIATION OF U.S. FEDERAL STATUTORY INCOME TAX RATE TO ACTUAL INCOME TAX RATE
Consolidated GE GECC
2012 2011 2010 2012 2011 2010 2012 2011 2010
U.S. federal statutory income tax rate 35.0% 35.0% 35.0% 35.0% 35.0% 35.0% 35.0% 35.0% 35.0%
Increase (reduction) in rate resulting
from inclusion of after-tax earnings
of GECC in before-tax earnings of GE ———(15.4) (12.0) (7.2) ———
Tax on global activities including exports (12.7) (10.6) (19.8) (4.2) (5.2) (10.7) (18.9) (15.0) (54.8)
NBCU gain —9.3 — —9.8 — ———
Business Property disposition (1.9) —————(4.2) ——
U.S. business credits (a) (2.6) (3.2) (4.4) (0.7) (1.5) (2.2) (4.3) (4.7) (13.5)
All other—net (3.4) (2.2) (3.5) (2.8) (0.9) (1.5) (1.4) (3.5) (12.5)
(20.6) (6.7) (27.7) (23.1) (9.8) (21.6) (28.8) (23.2) (80.8)
Actual income tax rate 14.4% 28.3% 7.3% 11.9% 25.2% 13.4% 6.2% 11.8% (45.8)%
(a) U.S. general business credits, primarily the credit for manufacture of energy efficient appliances, the credit for energy produced from renewable sources, the advanced
energy project credit, the low-income housing credit and the credit for research performed in the U.S.
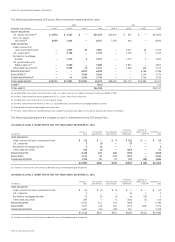
DEFERRED INCOME TAXES
Aggregate deferred income tax amounts are summarized below.
December 31 (In millions) 2012 2011
ASSETS
GE $(19,745) $(19,769)
GECC (12,185) (10,919)
(31,930) (30,688)
LIABILITIES
GE 13,799 12,586
GECC 18,056 17,971
31,855 30,557
Net deferred income tax liability (asset) $ (75) $ (131)
Principal components of our net liability (asset) representing
deferred income tax balances are as follows:
December 31 (In millions) 2012 2011
GE
Investment in NBCU LLC $ 4,937 $ 4,699
Contract costs and estimated earnings 3,087 2,834
Intangible assets 2,269 1,701
Investments in global subsidiaries 921 780
Depreciation 698 574
Provision for expenses (a) (6,503) (6,745)
Principal pension plans (6,567) (6,431)
Retiree insurance plans (3,800) (4,218)
Non-U.S. loss carryforwards (b) (942) (1,039)
Other—net (46) 662
(5,946) (7,183)
GECC
Financing leases 4,506 6,718
Operating leases 5,939 5,030
Intangible assets 1,657 1,689
Investments in global subsidiaries (1,451) 85
Allowance for losses (1,964) (2,949)
Non-U.S. loss carryforwards (b) (3,115) (2,861)
Cash flow hedges 119 (104)
Net unrealized gains (losses) on securities 321 (64)
Other—net (141) (492)
5,871 7,052
Net deferred income tax liability (asset) $ (75) $ (131)
(a) Represented the tax effects of temporary differences related to expense
accruals for a wide variety of items, such as employee compensation and
benefits, other pension plan liabilities, interest on tax liabilities, product
warranties and other sundry items that are not currently deductible.
(b) Net of valuation allowances of $1,712 million and $1,183 million for GE and
$628 million and $613 million for GECC, for 2012 and 2011, respectively. Of the
net deferred tax asset as of December 31, 2012, of $4,057 million, $98 million
relates to net operating loss carryforwards that expire in various years ending
from December 31, 2013, through December 31, 2015; $232 million relates to net
operating losses that expire in various years ending from December 31, 2016,
through December 31, 2029 and $3,727 million relates to net operating loss
carryforwards that may be carried forward indefinitely.