GE 2012 Annual Report Download - page 123
Download and view the complete annual report
Please find page 123 of the 2012 GE annual report below. You can navigate through the pages in the report by either clicking on the pages listed below, or by using the keyword search tool below to find specific information within the annual report.-
 1
1 -
2
-
3
-
4
-
5
-
6
-
7
-
8
-
9
-
10
-
11
-
12
-
13
-
14
-
15
-
16
-
17
-
18
-
19
-
20
-
21
-
22
-
23
-
24
-
25
-
26
-
27
-
28
-
29
-
30
-
31
-
32
-
33
-
34
-
35
-
36
-
37
-
38
-
39
-
40
-
41
-
42
-
43
-
44
-
45
-
46
-
47
-
48
-
49
-
50
-
51
-
52
-
53
-
54
-
55
-
56
-
57
-
58
-
59
-
60
-
61
-
62
-
63
-
64
-
65
-
66
-
67
-
68
-
69
-
70
-
71
-
72
-
73
-
74
-
75
-
76
-
77
-
78
-
79
-
80
-
81
-
82
-
83
-
84
-
85
-
86
-
87
-
88
-
89
-
90
-
91
-
92
-
93
-
94
-
95
-
96
-
97
-
98
-
99
-
100
-
101
-
102
-
103
-
104
-
105
-
106
-
107
-
108
-
109
-
110
-
111
-
112
-
 113
113 -
 114
114 -
 115
115 -
 116
116 -
 117
117 -
 118
118 -
 119
119 -
 120
120 -
 121
121 -
 122
122 -
 123
123 -
 124
124 -
 125
125 -
 126
126 -
 127
127 -
 128
128 -
 129
129 -
 130
130 -
 131
131 -
 132
132 -
 133
133 -
134
-
135
-
136
-
137
-
138
-
139
-
140
-
141
-
142
-
143
-
144
-
145
-
146
-
147
-
148
-
149
-
150
 |
 |

GE 2012 ANNUAL REPORT 121
notes to consolidated financial statements
Note 22.
Financial Instruments
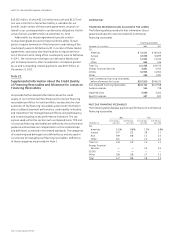
The following table provides information about the assets and liabilities not carried at fair value in our Statement of Financial Position.
Consistent with ASC 825, Financial Instruments, the table excludes finance leases and non-financial assets and liabilities. Substantially all
of the assets discussed below are considered to be Level 3 in accordance with ASC 820. The vast majority of our liabilities’ fair value can
be determined based on significant observable inputs and thus considered Level 2 in accordance with ASC 820. Few of the instruments
are actively traded and their fair values must often be determined using financial models. Realization of the fair value of these instru-
ments depends upon market forces beyond our control, including marketplace liquidity.
2012 2011
Assets (liabilities) Assets (liabilities)
December 31 (In millions)
Notional
amount
Carrying
amount (net)
Estimated
fair value
Notional
amount
Carrying
amount (net)
Estimated
fair value
GE
Assets
Investments and notes receivable $ (a) $ 222 $ 222 $ (a) $ 285 $ 285
Liabilities
Borrowings (b) (a) (17,469) (18,619) (a) (11,589) (12,535)
GECC
Assets
Loans (a) 236,678 239,084 (a) 250,999 251,433
Other commercial mortgages (a) 2,222 2,249 (a) 1,494 1,537
Loans held for sale (a) 1,180 1,181 (a) 496 497
Other financial instruments (c) (a) 1,858 2,276 (a) 2,071 2,534
Liabilities
Borrowings and bank deposits (b) (d) (a) (397,300) (414,533) (a) (443,097) (449,403)
Investment contract benefits (a) (3,321) (4,150) (a) (3,493) (4,240)
Guaranteed investment contracts (a) (1,644) (1,674) (a) (4,226) (4,266)
Insurance—credit life (e) 2,277 (120) (104) 1,944 (106) (88)
(a) These financial instruments do not have notional amounts.
(b) See Note 10.
(c) Principally cost method investments.
(d) Fair values exclude interest rate and currency derivatives designated as hedges of borrowings. Had they been included, the fair value of borrowings at December 31, 2012
and 2011 would have been reduced by $7,937 million and $9,051 million, respectively.
(e) Net of reinsurance of $2,000 million at both December 31, 2012 and 2011.
A description of how we estimate fair values follows.
Loans
Based on a discounted future cash flows methodology, using cur-
rent market interest rate data adjusted for inherent credit risk or
quoted market prices and recent transactions, if available.
Borrowings and bank deposits
Based on valuation methodologies using current market interest
rate data which are comparable to market quotes adjusted for
our non-performance risk.
Investment contract benefits
Based on expected future cash flows, discounted at currently
offered rates for immediate annuity contracts or the income
approach for single premium deferred annuities.
Guaranteed investment contracts
Based on valuation methodologies using current market interest
rate data, adjusted for our non-performance risk.
All other instruments
Based on observable market transactions and/or valuation meth-
odologies using current market interest rate data adjusted for
inherent credit risk.
Assets and liabilities that are reflected in the accompanying
financial statements at fair value are not included in the above
disclosures; such items include cash and equivalents, investment
securities and derivative financial instruments.
Additional information about certain categories in the table
above follows.
INSURANCE—CREDIT LIFE
Certain insurance affiliates, primarily in Consumer, issue credit
life insurance designed to pay the balance due on a loan if the
borrower dies before the loan is repaid. As part of our overall risk
management process, we cede to third parties a portion of this
associated risk, but are not relieved of our primary obligation
to policyholders.