GE 2012 Annual Report Download - page 117
Download and view the complete annual report
Please find page 117 of the 2012 GE annual report below. You can navigate through the pages in the report by either clicking on the pages listed below, or by using the keyword search tool below to find specific information within the annual report.-
 1
1 -
2
-
3
-
4
-
5
-
6
-
7
-
8
-
9
-
10
-
11
-
12
-
13
-
14
-
15
-
16
-
17
-
18
-
19
-
20
-
21
-
22
-
23
-
24
-
25
-
26
-
27
-
28
-
29
-
30
-
31
-
32
-
33
-
34
-
35
-
36
-
37
-
38
-
39
-
40
-
41
-
42
-
43
-
44
-
45
-
46
-
47
-
48
-
49
-
50
-
51
-
52
-
53
-
54
-
55
-
56
-
57
-
58
-
59
-
60
-
61
-
62
-
63
-
64
-
65
-
66
-
67
-
68
-
69
-
70
-
71
-
72
-
73
-
74
-
75
-
76
-
77
-
78
-
79
-
80
-
81
-
82
-
83
-
84
-
85
-
86
-
87
-
88
-
89
-
90
-
91
-
92
-
93
-
94
-
95
-
96
-
97
-
98
-
99
-
100
-
101
-
102
-
103
-
104
-
105
-
106
-
 107
107 -
 108
108 -
 109
109 -
 110
110 -
 111
111 -
 112
112 -
 113
113 -
 114
114 -
 115
115 -
 116
116 -
 117
117 -
 118
118 -
 119
119 -
 120
120 -
 121
121 -
 122
122 -
 123
123 -
 124
124 -
 125
125 -
 126
126 -
 127
127 -
128
-
129
-
130
-
131
-
132
-
133
-
134
-
135
-
136
-
137
-
138
-
139
-
140
-
141
-
142
-
143
-
144
-
145
-
146
-
147
-
148
-
149
-
150
 |
 |

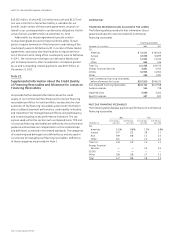
GE 2012 ANNUAL REPORT 115
notes to consolidated financial statements
share-based compensation expense for RSUs and PSUs recog-
nized in net earnings amounted to $79 million, $84 million and
$116 million in 2012, 2011 and 2010, respectively.
The income tax benefit recognized in earnings based on the
compensation expense recognized for all share-based compen-
sation arrangements amounted to $153 million, $163 million and
$143 million in 2012, 2011 and 2010, respectively. The excess of
actual tax deductions over amounts assumed, which are rec-
ognized in shareowners’ equity, were insignificant in 2012, 2011
and 2010.
When stock options are exercised and restricted stock vests,
the difference between the assumed tax benefit and the actual
tax benefit must be recognized in our financial statements. In
circumstances in which the actual tax benefit is lower than the
estimated tax benefit, that difference is recorded in equity, to
the extent there are sufficient accumulated excess tax ben-
efits. At December 31, 2012, our accumulated excess tax benefits
are sufficient to absorb any future differences between actual
and estimated tax benefits for all of our outstanding option and
restricted stock grants.
Note 17.
Other Income
(In millions) 2012 2011 2010
GE
Associated companies (a) $1,545 $ 894 $ 413
Purchases and sales of business
interests (b) 574 3,804 319
Licensing and royalty income 290 304 364
Interest income from GECC 114 206 133
Marketable securities and bank deposits 38 52 40
Other items 96 10 16
2,657 5,270 1,285
ELIMINATIONS (94) (206) (134)
Total $2,563 $5,064 $1,151
(a) Included income of $1,416 million and $789 million from our equity method
investment in NBCU LLC in 2012 and 2011, respectively.
(b) Included a pre-tax gain of $3,705 million ($526 million after tax) related to our
transfer of the assets of our NBCU business to a newly formed entity, NBCU LLC,
in 2011. See Note 2.
Note 18.
GECC Revenues from Services
(In millions) 2012 2011 2010
Interest on loans $19,074 $20,056 $20,810
Equipment leased to others 10,855 11,343 11,116
Fees 4,732 4,698 4,734
Investment income (a) 2,630 2,500 2,185
Financing leases 1,888 2,378 2,749
Associated companies (b) 1,538 2,337 2,035
Premiums earned by insurance
activities 1,714 1,905 2,014
Real estate investments 1,709 1,625 1,240
Other items 1,780 2,078 2,440
45,920 48,920 49,323
ELIMINATIONS (1,273) (1,219) (1,343)
Total $44,647 $47,701 $47,980
(a) Included net other-than-temporary impairments on investment securities of
$140 million, $387 million and $253 million in 2012, 2011 and 2010, respectively.
See Note 3.
(b) During 2011, we sold an 18.6% equity interest in Garanti Bank and recorded a
pre-tax gain of $690 million. During 2012, we sold our remaining equity interest
in Garanti Bank, which was classified as an available-for-sale security.
Note 19.
Supplemental Cost Information
We funded research and development expenditures of
$4,520 million in 2012, $4,601 million in 2011 and $3,939 million
in 2010. Research and development costs are classified in cost
of goods sold in the Statement of Earnings. In addition, research
and development funding from customers, principally the U.S.
government, totaled $680 million, $788 million and $979 million in
2012, 2011 and 2010, respectively.
Rental expense under operating leases is shown below.
(In millions) 2012 2011 2010
GE $1,170 $968 $1,073
GECC 561 615 637
At December 31, 2012, minimum rental commitments under
noncancellable operating leases aggregated $2,474 million and
$1,583 million for GE and GECC, respectively. Amounts payable
over the next five years follow.
(In millions) 2013 2014 2015 2016 2017
GE $567 $499 $393 $331 $274
GECC 318 245 201 164 136