GE 2012 Annual Report Download - page 76
Download and view the complete annual report
Please find page 76 of the 2012 GE annual report below. You can navigate through the pages in the report by either clicking on the pages listed below, or by using the keyword search tool below to find specific information within the annual report.-
 1
1 -
2
-
3
-
4
-
5
-
6
-
7
-
8
-
9
-
10
-
11
-
12
-
13
-
14
-
15
-
16
-
17
-
18
-
19
-
20
-
21
-
22
-
23
-
24
-
25
-
26
-
27
-
28
-
29
-
30
-
31
-
32
-
33
-
34
-
35
-
36
-
37
-
38
-
39
-
40
-
41
-
42
-
43
-
44
-
45
-
46
-
47
-
48
-
49
-
50
-
51
-
52
-
53
-
54
-
55
-
56
-
57
-
58
-
59
-
60
-
61
-
62
-
63
-
64
-
65
-
 66
66 -
 67
67 -
 68
68 -
 69
69 -
 70
70 -
 71
71 -
 72
72 -
 73
73 -
 74
74 -
 75
75 -
 76
76 -
 77
77 -
 78
78 -
 79
79 -
 80
80 -
 81
81 -
 82
82 -
 83
83 -
 84
84 -
 85
85 -
 86
86 -
87
-
88
-
89
-
90
-
91
-
92
-
93
-
94
-
95
-
96
-
97
-
98
-
99
-
100
-
101
-
102
-
103
-
104
-
105
-
106
-
107
-
108
-
109
-
110
-
111
-
112
-
113
-
114
-
115
-
116
-
117
-
118
-
119
-
120
-
121
-
122
-
123
-
124
-
125
-
126
-
127
-
128
-
129
-
130
-
131
-
132
-
133
-
134
-
135
-
136
-
137
-
138
-
139
-
140
-
141
-
142
-
143
-
144
-
145
-
146
-
147
-
148
-
149
-
150
 |
 |

74 GE 2012 ANNUAL REPORT
audited financial statements
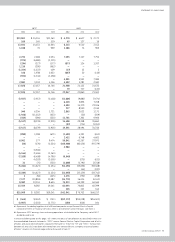
Statement of Cash Flows
General Electric Company and
consolidated affiliates
For the years ended December 31 (In millions) 2012 2011 2010
CASH FLOWS—OPERATING ACTIVITIES
Net earnings $ 13,864 $ 14,443 $ 12,179
Less net earnings attributable to noncontrolling interests 223 292 535
Net earnings attributable to the Company 13,641 14,151 11,644
(Earnings) loss from discontinued operations 1,038 76 969
Adjustments to reconcile net earnings attributable to the Company
to cash provided from operating activities
Depreciation and amortization of property, plant and equipment 9,346 9,185 9,786
Earnings from continuing operations retained by GECC (b) — — —
Deferred income taxes (1,171) (203) 930
Decrease (increase) in GE current receivables (774) (714) (60)
Decrease (increase) in inventories (1,274) (1,168) 342
Increase (decrease) in accounts payable (424) 1,235 883
Increase (decrease) in GE progress collections (920) (1,146) (1,243)
Provision for losses on GECC financing receivables 3,891 3,951 7,085
All other operating activities 7,899 7,255 5,921
Cash from (used for) operating activities—continuing operations 31,252 32,622 36,257
Cash from (used for) operating activities—discontinued operations 79 737 (133)
CASH FROM (USED FOR) OPERATING ACTIVITIES 31,331 33,359 36,124
CASH FLOWS—INVESTING ACTIVITIES
Additions to property, plant and equipment (15,126) (12,650) (9,800)
Dispositions of property, plant and equipment 6,200 5,896 7,208
Net decrease (increase) in GECC financing receivables 6,872 14,630 21,758
Proceeds from sales of discontinued operations 227 8,950 2,510
Proceeds from principal business dispositions 3,618 8,877 3,062
Payments for principal businesses purchased (1,456) (11,202) (1,212)
All other investing activities 11,064 6,095 10,262
Cash from (used for) investing activities—continuing operations 11,399 20,596 33,788
Cash from (used for) investing activities—discontinued operations (97) (714) (1,352)
CASH FROM (USED FOR) INVESTING ACTIVITIES 11,302 19,882 32,436
CASH FLOWS—FINANCING ACTIVITIES
Net increase (decrease) in borrowings (maturities of 90 days or less) (2,231) 5,951 (1,228)
Net increase (decrease) in bank deposits 2,432 6,748 4,603
Newly issued debt (maturities longer than 90 days) 63,019 43,847 47,643
Repayments and other reductions (maturities longer than 90 days) (103,942) (85,706) (99,933)
Proceeds from issuance of GECC preferred stock 3,960 — —
Repayment of preferred stock — (3,300) —
Net dispositions (purchases) of GE shares for treasury (4,164) (1,456) (1,263)
Dividends paid to shareowners (7,189) (6,458) (4,790)
Purchases of subsidiary shares from noncontrolling interests — (4,578) (2,633)
All other financing activities (2,959) (1,867) (3,648)
Cash from (used for) financing activities—continuing operations (51,074) (46,819) (61,249)
Cash from (used for) financing activities—discontinued operations — (44) (337)
CASH FROM (USED FOR) FINANCING ACTIVITIES (51,074) (46,863) (61,586)
Effect of exchange rate changes on cash and equivalents 1,278 (841) (333)
Increase (decrease) in cash and equivalents (7,163) 5,537 6,641
Cash and equivalents at beginning of year 84,622 79,085 72,444
Cash and equivalents at end of year 77,459 84,622 79,085
Less cash and equivalents of discontinued operations at end of year 103 121 142
Cash and equivalents of continuing operations at end of year $ 77,356 $ 84,501 $ 78,943
SUPPLEMENTAL DISCLOSURE OF CASH FLOWS INFORMATION
Cash paid during the year for interest $ (12,717) $(15,571) $(17,132)
Cash recovered (paid) during the year for income taxes (3,237) (2,919) (2,671)
See accompanying notes.