GE 2012 Annual Report Download - page 132
Download and view the complete annual report
Please find page 132 of the 2012 GE annual report below. You can navigate through the pages in the report by either clicking on the pages listed below, or by using the keyword search tool below to find specific information within the annual report.-
 1
1 -
2
-
3
-
4
-
5
-
6
-
7
-
8
-
9
-
10
-
11
-
12
-
13
-
14
-
15
-
16
-
17
-
18
-
19
-
20
-
21
-
22
-
23
-
24
-
25
-
26
-
27
-
28
-
29
-
30
-
31
-
32
-
33
-
34
-
35
-
36
-
37
-
38
-
39
-
40
-
41
-
42
-
43
-
44
-
45
-
46
-
47
-
48
-
49
-
50
-
51
-
52
-
53
-
54
-
55
-
56
-
57
-
58
-
59
-
60
-
61
-
62
-
63
-
64
-
65
-
66
-
67
-
68
-
69
-
70
-
71
-
72
-
73
-
74
-
75
-
76
-
77
-
78
-
79
-
80
-
81
-
82
-
83
-
84
-
85
-
86
-
87
-
88
-
89
-
90
-
91
-
92
-
93
-
94
-
95
-
96
-
97
-
98
-
99
-
100
-
101
-
102
-
103
-
104
-
105
-
106
-
107
-
108
-
109
-
110
-
111
-
112
-
113
-
114
-
115
-
116
-
117
-
118
-
119
-
120
-
121
-
 122
122 -
 123
123 -
 124
124 -
 125
125 -
 126
126 -
 127
127 -
 128
128 -
 129
129 -
 130
130 -
 131
131 -
 132
132 -
 133
133 -
 134
134 -
 135
135 -
 136
136 -
 137
137 -
 138
138 -
 139
139 -
 140
140 -
 141
141 -
 142
142 -
143
-
144
-
145
-
146
-
147
-
148
-
149
-
150
 |
 |

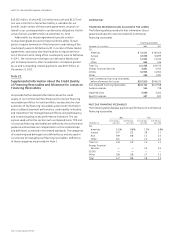
130 GE 2012 ANNUAL REPORT
notes to consolidated financial statements
CREDIT QUALITY INDICATORS
Our Consumer financing receivables portfolio comprises both
secured and unsecured lending. Secured financing receivables
comprise residential loans and lending to small and medium-
sized enterprises predominantly secured by auto and equipment,
inventory finance and cash flow loans. Unsecured financing
receivables include private label credit card financing. A substan-
tial majority of these cards are not for general use and are limited
to the products and services sold by the retailer. The private label
portfolio is diverse with no metropolitan area accounting for
more than 5% of the related portfolio.
NON-U.S. RESIDENTIAL MORTGAGES
For our secured non-U.S. residential mortgage book, we assess
the overall credit quality of the portfolio through loan-to-value
ratios (the ratio of the outstanding debt on a property to the
value of that property at origination). In the event of default
and repossession of the underlying collateral, we have the abil-
ity to remarket and sell the properties to eliminate or mitigate
the potential risk of loss. The table below provides additional
information about our non-U.S. residential mortgages based on
loan-to-value ratios.
Loan-to-value ratio
December 31 (In millions) 80% or less
Greater than
80% to 90%
Greater
than 90%
2012
Non-U.S. residential
mortgages $18,613 $5,739 $9,099
2011
Non-U.S. residential
mortgages $19,834 $6,087 $9,629
The majority of these financing receivables are in our U.K. and France
portfolios and have re-indexed loan-to-value ratios of 83% and 56%,
respectively. We have third-party mortgage insurance for about 35%
of the balance of Consumer non-U.S. residential mortgage loans with
loan-to-value ratios greater than 90% at December 31, 2012. Such
loans were primarily originated in Poland, France and the U.K.
INSTALLMENT AND REVOLVING CREDIT
For our unsecured lending products, including the non-U.S. and
U.S. installment and revolving credit and non-U.S. auto portfo-
lios, we assess overall credit quality using internal and external
credit scores. Our internal credit scores imply a probability of
default which we consistently translate into three approximate
credit bureau equivalent credit score categories, including (a) 681
or higher, which are considered the strongest credits; (b) 615 to
680, considered moderate credit risk; and (c) 614 or less, which are
considered weaker credits.
Internal ratings translated to approximate
credit bureau equivalent score
December 31 (In millions) 681 or higher 615 to 680 614 or less
2012
Non-U.S. installment
and revolving credit $ 10,493 $4,496 $3,557
U.S. installment
and revolving credit 33,204 9,753 7,896
Non-U.S. auto 3,141 666 453
2011
Non-U.S. installment
and revolving credit $ 9,913 $4,838 $3,793
U.S. installment
and revolving credit 28,918 9,398 8,373
Non-U.S. auto 3,927 1,092 672
Of those financing receivable accounts with credit bureau equiva-
lent scores of 614 or less at December 31, 2012, 96% relate to
installment and revolving credit accounts. These smaller balance
accounts have an average outstanding balance less than one
thousand U.S. dollars and are primarily concentrated in our retail
card and sales finance receivables in the U.S. (which are often
subject to profit and loss-sharing arrangements), and closed-end
loans outside the U.S., which minimizes the potential for loss in
the event of default. For lower credit scores, we adequately price
for the incremental risk at origination and monitor credit migra-
tion through our risk ratings process. We continuously adjust our
credit line underwriting management and collection strategies
based on customer behavior and risk profile changes.
CONSUMER—OTHER
Secured lending in Consumer—Other comprises loans to small and
medium-sized enterprises predominantly secured by auto and
equipment, inventory finance and cash flow loans. We develop our
internal risk ratings for this portfolio in a manner consistent with
the process used to develop our Commercial credit quality indica-
tors, described above. We use the borrower’s credit quality and
underlying collateral strength to determine the potential risk of
loss from these activities.
At December 31, 2012, Consumer—Other financing receiv-
ables of $6,873 million, $451 million and $746 million were rated
A, B and C, respectively. At December 31, 2011, Consumer—Other
financing receivables of $5,580 million, $757 million and $907 mil-
lion were rated A, B and C, respectively.