GE 2012 Annual Report Download - page 131
Download and view the complete annual report
Please find page 131 of the 2012 GE annual report below. You can navigate through the pages in the report by either clicking on the pages listed below, or by using the keyword search tool below to find specific information within the annual report.-
 1
1 -
2
-
3
-
4
-
5
-
6
-
7
-
8
-
9
-
10
-
11
-
12
-
13
-
14
-
15
-
16
-
17
-
18
-
19
-
20
-
21
-
22
-
23
-
24
-
25
-
26
-
27
-
28
-
29
-
30
-
31
-
32
-
33
-
34
-
35
-
36
-
37
-
38
-
39
-
40
-
41
-
42
-
43
-
44
-
45
-
46
-
47
-
48
-
49
-
50
-
51
-
52
-
53
-
54
-
55
-
56
-
57
-
58
-
59
-
60
-
61
-
62
-
63
-
64
-
65
-
66
-
67
-
68
-
69
-
70
-
71
-
72
-
73
-
74
-
75
-
76
-
77
-
78
-
79
-
80
-
81
-
82
-
83
-
84
-
85
-
86
-
87
-
88
-
89
-
90
-
91
-
92
-
93
-
94
-
95
-
96
-
97
-
98
-
99
-
100
-
101
-
102
-
103
-
104
-
105
-
106
-
107
-
108
-
109
-
110
-
111
-
112
-
113
-
114
-
115
-
116
-
117
-
118
-
119
-
120
-
 121
121 -
 122
122 -
 123
123 -
 124
124 -
 125
125 -
 126
126 -
 127
127 -
 128
128 -
 129
129 -
 130
130 -
 131
131 -
 132
132 -
 133
133 -
 134
134 -
 135
135 -
 136
136 -
 137
137 -
 138
138 -
 139
139 -
 140
140 -
 141
141 -
142
-
143
-
144
-
145
-
146
-
147
-
148
-
149
-
150
 |
 |

GE 2012 ANNUAL REPORT 129
notes to consolidated financial statements
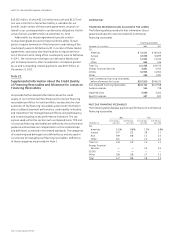
PAST DUE FINANCING RECEIVABLES
The following table displays payment performance of Consumer
financing receivables.
2012 2011
December 31
Over 30 days
past due
Over 90 days
past due (a) Over 30 days
past due
Over 90 days
past due (a)
Non-U.S. residential
mortgages 12.0% 7.5% 12.3% 7.9%
Non-U.S. installment
and revolving credit 3.9 1.1 4.1 1.2
U.S. installment and
revolving credit 4.6 2.0 5.0 2.2
Non-U.S. auto 3.1 0.5 3.1 0.6
Other 2.8 1.7 3.5 2.0
Total 6.5 3.4 6.9 3.7
(a) Included $24 million and $45 million of loans at December 31, 2012 and 2011,
respectively, which are over 90 days past due and accruing interest, mainly
representing accretion on loans acquired at a discount.
NONACCRUAL FINANCING RECEIVABLES
The following table provides further information about Consumer
financing receivables that are classified as nonaccrual.
Nonaccrual financing
receivables
Nonearning financing
receivables
December 31 (Dollars in millions) 2012 2011 2012 2011
Non-U.S. residential
mortgages $2,600 $2,995 $2,569 $2,870
Non-U.S. installment
and revolving credit 224 321 224 263
U.S. installment and
revolving credit 1,026 990 1,026 990
Non-U.S. auto 24 43 24 43
Other 427 487 351 419
Total $4,301 $4,836 $4,194 $4,585
Allowance for losses
percentage 84.3% 73.8% 86.4% 77.9%
IMPAIRED LOANS
The vast majority of our Consumer nonaccrual financing
receivables are smaller balance homogeneous loans evaluated
collectively, by portfolio, for impairment and therefore are out-
side the scope of the disclosure requirement for impaired loans.
Accordingly, impaired loans in our Consumer business represent
restructured smaller balance homogeneous loans meeting the
definition of a TDR, and are therefore subject to the disclosure
requirement for impaired loans, and commercial loans in our
Consumer—Other portfolio. The recorded investment of these
impaired loans totaled $3,220 million (with an unpaid principal
balance of $3,269 million) and comprised $105 million with no
specific allowance, primarily all in our Consumer—Other portfolio,
and $3,115 million with a specific allowance of $674 million at
December 31, 2012. The impaired loans with a specific allowance
included $309 million with a specific allowance of $83 million in
our Consumer—Other portfolio and $2,806 million with a spe-
cific allowance of $591 million across the remaining Consumer
business and had an unpaid principal balance and average
investment of $3,152 million and $2,956 million, respectively, at
December 31, 2012. We recognized $169 million and $141 million
of interest income, including $5 million and $15 million on a cash
basis, for the years ended December 31, 2012 and 2011, respec-
tively, principally in our Consumer—Non-U.S. and U.S. installment
and revolving credit portfolios. The total average investment in
impaired loans for the years ended December 31, 2012 and 2011
was $3,056 million and $2,623 million, respectively.
Impaired loans classified as TDRs in our Consumer business
were $3,053 million and $2,723 million at December 31, 2012 and
2011, respectively. We utilize certain loan modification programs
for borrowers experiencing financial difficulties in our Consumer
loan portfolio. These loan modification programs primarily include
interest rate reductions and payment deferrals in excess of three
months, which were not part of the terms of the original con-
tract, and are primarily concentrated in our non-U.S. residential
mortgage and U.S. credit card portfolios. For the year ended
December 31, 2012, we modified $1,756 million of consumer loans
for borrowers experiencing financial difficulties, which are classified
as TDRs, and included $1,186 million of non-U.S. consumer loans,
primarily residential mortgages, credit cards and personal loans
and $570 million of U.S. consumer loans, primarily credit cards. We
expect borrowers whose loans have been modified under these
programs to continue to be able to meet their contractual obliga-
tions upon the conclusion of the modification. Of our $1,756 million
of modifications classified as TDRs during 2012, $334 million have
subsequently experienced a payment default in 2012, primarily in
our installment and revolving credit portfolios. Of our $1,924 million
of modifications classified as TDRs during 2011, $240 million have
subsequently experienced a payment default in 2011.