GE 2012 Annual Report Download - page 112
Download and view the complete annual report
Please find page 112 of the 2012 GE annual report below. You can navigate through the pages in the report by either clicking on the pages listed below, or by using the keyword search tool below to find specific information within the annual report.-
 1
1 -
2
-
3
-
4
-
5
-
6
-
7
-
8
-
9
-
10
-
11
-
12
-
13
-
14
-
15
-
16
-
17
-
18
-
19
-
20
-
21
-
22
-
23
-
24
-
25
-
26
-
27
-
28
-
29
-
30
-
31
-
32
-
33
-
34
-
35
-
36
-
37
-
38
-
39
-
40
-
41
-
42
-
43
-
44
-
45
-
46
-
47
-
48
-
49
-
50
-
51
-
52
-
53
-
54
-
55
-
56
-
57
-
58
-
59
-
60
-
61
-
62
-
63
-
64
-
65
-
66
-
67
-
68
-
69
-
70
-
71
-
72
-
73
-
74
-
75
-
76
-
77
-
78
-
79
-
80
-
81
-
82
-
83
-
84
-
85
-
86
-
87
-
88
-
89
-
90
-
91
-
92
-
93
-
94
-
95
-
96
-
97
-
98
-
99
-
100
-
101
-
 102
102 -
 103
103 -
 104
104 -
 105
105 -
 106
106 -
 107
107 -
 108
108 -
 109
109 -
 110
110 -
 111
111 -
 112
112 -
 113
113 -
 114
114 -
 115
115 -
 116
116 -
 117
117 -
 118
118 -
 119
119 -
 120
120 -
 121
121 -
 122
122 -
123
-
124
-
125
-
126
-
127
-
128
-
129
-
130
-
131
-
132
-
133
-
134
-
135
-
136
-
137
-
138
-
139
-
140
-
141
-
142
-
143
-
144
-
145
-
146
-
147
-
148
-
149
-
150
 |
 |

110 GE 2012 ANNUAL REPORT
notes to consolidated financial statements
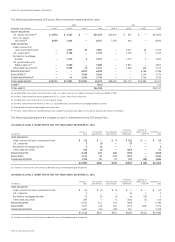
Note 15.
Shareowners’ Equity
(In millions) 2012 2011 2010
PREFERRED STOCK ISSUED $ — $ — $ —
COMMON STOCK ISSUED $ 702 $ 702 $ 702
ACCUMULATED OTHER COMPREHENSIVE INCOME
Balance at January 1 (a) $ (23,974) $ (17,855) $ (15,530)
Other comprehensive income before reclassifications 329 (9,601) (5,073)
Reclassifications from other comprehensive income 3,415 3,482 2,748
Other comprehensive income, net, attributable to GE 3,744 (6,119) (2,325)
Balance at December 31 $ (20,230) $ (23,974) $ (17,855)
OTHER CAPITAL
Balance at January 1 $ 33,693 $ 36,890 $ 37,729
Gains (losses) on treasury stock dispositions and other (623) (703) (839)
Preferred stock redemption —(2,494) —
Balance at December 31 $ 33,070 $ 33,693 $ 36,890
RETAINED EARNINGS
Balance at January 1 (b) $137,786 $131,137 $124,655
Net earnings attributable to the Company 13,641 14,151 11,644
Dividends (c) (7,372) (7,498) (5,212)
Other (d) —(4) 50
Balance at December 31 $144,055 $137,786 $131,137
COMMON STOCK HELD IN TREASURY
Balance at January 1 $ (31,769) $ (31,938) $ (32,238)
Purchases (5,295) (2,067) (1,890)
Dispositions 2,493 2,236 2,190
Balance at December 31 $ (34,571) $ (31,769) $ (31,938)
TOTAL EQUITY
GE shareowners’ equity balance at December 31 $123,026 $116,438 $118,936
Noncontrolling interests balance at December 31 5,444 1,696 5,262
Total equity balance at December 31 $128,470 $118,134 $124,198
(a) The 2010 opening balance was adjusted as of January 1, 2010, for the cumulative effect of changes in accounting principles of $265 million related to the adoption of
ASU 2009-16 & 17.
(b) The 2010 opening balance was adjusted as of January 1, 2010, for the cumulative effect of changes in accounting principles of $1,708 million related to the adoption of
ASU 2009-16 & 17.
(c) Included $1,031 million ($806 million related to our preferred stock redemption) and $300 million of dividends on preferred stock in 2011 and 2010, respectively.
(d) Included the effects of accretion of redeemable securities to their redemption value of $38 million in 2010.