GE 2012 Annual Report Download - page 129
Download and view the complete annual report
Please find page 129 of the 2012 GE annual report below. You can navigate through the pages in the report by either clicking on the pages listed below, or by using the keyword search tool below to find specific information within the annual report.-
 1
1 -
2
-
3
-
4
-
5
-
6
-
7
-
8
-
9
-
10
-
11
-
12
-
13
-
14
-
15
-
16
-
17
-
18
-
19
-
20
-
21
-
22
-
23
-
24
-
25
-
26
-
27
-
28
-
29
-
30
-
31
-
32
-
33
-
34
-
35
-
36
-
37
-
38
-
39
-
40
-
41
-
42
-
43
-
44
-
45
-
46
-
47
-
48
-
49
-
50
-
51
-
52
-
53
-
54
-
55
-
56
-
57
-
58
-
59
-
60
-
61
-
62
-
63
-
64
-
65
-
66
-
67
-
68
-
69
-
70
-
71
-
72
-
73
-
74
-
75
-
76
-
77
-
78
-
79
-
80
-
81
-
82
-
83
-
84
-
85
-
86
-
87
-
88
-
89
-
90
-
91
-
92
-
93
-
94
-
95
-
96
-
97
-
98
-
99
-
100
-
101
-
102
-
103
-
104
-
105
-
106
-
107
-
108
-
109
-
110
-
111
-
112
-
113
-
114
-
115
-
116
-
117
-
118
-
 119
119 -
 120
120 -
 121
121 -
 122
122 -
 123
123 -
 124
124 -
 125
125 -
 126
126 -
 127
127 -
 128
128 -
 129
129 -
 130
130 -
 131
131 -
 132
132 -
 133
133 -
 134
134 -
 135
135 -
 136
136 -
 137
137 -
 138
138 -
 139
139 -
140
-
141
-
142
-
143
-
144
-
145
-
146
-
147
-
148
-
149
-
150
 |
 |

GE 2012 ANNUAL REPORT 127
notes to consolidated financial statements
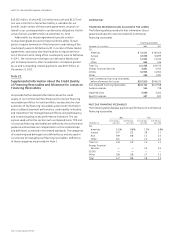
Real Estate
FINANCING RECEIVABLES AND ALLOWANCE FOR LOSSES
The following table provides further information about general
and specific reserves related to Real Estate financing receivables.
Financing receivables
December 31 (In millions) 2012 2011
Debt $19,746 $24,501
Business Properties (a) 1,200 8,248
Total Real Estate financing receivables, before
allowance for losses $20,946 $32,749
Non-impaired financing receivables $15,253 $24,002
General reserves 132 267
Impaired loans 5,693 8,747
Specific reserves 188 822
(a) In 2012, we completed the sale of a portion of our Business Properties portfolio.
PAST DUE FINANCING RECEIVABLES
The following table displays payment performance of Real Estate
financing receivables.
2012 2011
December 31
Over 30 days
past due
Over 90 days
past due
Over 30 days
past due
Over 90 days
past due
Debt 1.7% 1.7% 2.4% 2.3%
Business Properties 10.8 10.2 3.9 3.0
Total 2.3 2.2 2.8 2.5
NONACCRUAL FINANCING RECEIVABLES
The following table provides further information about Real Estate financing receivables that are classified as nonaccrual. Of our
$4,885 million and $6,949 million of nonaccrual financing receivables at December 31, 2012 and 2011, respectively, $4,461 million and
$6,061 million are currently paying in accordance with their contractual terms, respectively.
Nonaccrual financing
receivables
Nonearning financing
receivables
December 31 (Dollars in millions) 2012 2011 2012 2011
Debt $4,576 $6,351 $321 $541
Business Properties 309 598 123 249
Total $4,885 $6,949 $444 $790
Allowance for losses percentage 6.6% 15.7% 72.1% 137.8%
IMPAIRED LOANS
The following table provides information about loans classified as impaired and specific reserves related to Real Estate.
With no specific allowance With a specific allowance
December 31 (In millions)
Recorded
investment
in loans
Unpaid
principal
balance
Average
investment
in loans
Recorded
investment
in loans
Unpaid
principal
balance
Associated
allowance
Average
investment
in loans
2012
Debt $3,294 $3,515 $3,575 $2,077 $2,682 $156 $3,455
Business Properties 197 197 198 125 125 32 297
Total $3,491 $3,712 $3,773 $2,202 $2,807 $188 $3,752
2011
Debt $3,558 $3,614 $3,568 $4,560 $4,652 $717 $5,435
Business Properties 232 232 215 397 397 105 460
Total $3,790 $3,846 $3,783 $4,957 $5,049 $822 $5,895