HSBC 2006 Annual Report Download - page 127
Download and view the complete annual report
Please find page 127 of the 2006 HSBC annual report below. You can navigate through the pages in the report by either clicking on the pages listed below, or by using the keyword search tool below to find specific information within the annual report.-
 1
1 -
2
-
3
-
4
-
5
-
6
-
7
-
8
-
9
-
10
-
11
-
12
-
13
-
14
-
15
-
16
-
17
-
18
-
19
-
20
-
21
-
22
-
23
-
24
-
25
-
26
-
27
-
28
-
29
-
30
-
31
-
32
-
33
-
34
-
35
-
36
-
37
-
38
-
39
-
40
-
41
-
42
-
43
-
44
-
45
-
46
-
47
-
48
-
49
-
50
-
51
-
52
-
53
-
54
-
55
-
56
-
57
-
58
-
59
-
60
-
61
-
62
-
63
-
64
-
65
-
66
-
67
-
68
-
69
-
70
-
71
-
72
-
73
-
74
-
75
-
76
-
77
-
78
-
79
-
80
-
81
-
82
-
83
-
84
-
85
-
86
-
87
-
88
-
89
-
90
-
91
-
92
-
93
-
94
-
95
-
96
-
97
-
98
-
99
-
100
-
101
-
102
-
103
-
104
-
105
-
106
-
107
-
108
-
109
-
110
-
111
-
112
-
113
-
114
-
115
-
116
-
 117
117 -
 118
118 -
 119
119 -
 120
120 -
 121
121 -
 122
122 -
 123
123 -
 124
124 -
 125
125 -
 126
126 -
 127
127 -
 128
128 -
 129
129 -
 130
130 -
 131
131 -
 132
132 -
 133
133 -
 134
134 -
 135
135 -
 136
136 -
 137
137 -
138
-
139
-
140
-
141
-
142
-
143
-
144
-
145
-
146
-
147
-
148
-
149
-
150
-
151
-
152
-
153
-
154
-
155
-
156
-
157
-
158
-
159
-
160
-
161
-
162
-
163
-
164
-
165
-
166
-
167
-
168
-
169
-
170
-
171
-
172
-
173
-
174
-
175
-
176
-
177
-
178
-
179
-
180
-
181
-
182
-
183
-
184
-
185
-
186
-
187
-
188
-
189
-
190
-
191
-
192
-
193
-
194
-
195
-
196
-
197
-
198
-
199
-
200
-
201
-
202
-
203
-
204
-
205
-
206
-
207
-
208
-
209
-
210
-
211
-
212
-
213
-
214
-
215
-
216
-
217
-
218
-
219
-
220
-
221
-
222
-
223
-
224
-
225
-
226
-
227
-
228
-
229
-
230
-
231
-
232
-
233
-
234
-
235
-
236
-
237
-
238
-
239
-
240
-
241
-
242
-
243
-
244
-
245
-
246
-
247
-
248
-
249
-
250
-
251
-
252
-
253
-
254
-
255
-
256
-
257
-
258
-
259
-
260
-
261
-
262
-
263
-
264
-
265
-
266
-
267
-
268
-
269
-
270
-
271
-
272
-
273
-
274
-
275
-
276
-
277
-
278
-
279
-
280
-
281
-
282
-
283
-
284
-
285
-
286
-
287
-
288
-
289
-
290
-
291
-
292
-
293
-
294
-
295
-
296
-
297
-
298
-
299
-
300
-
301
-
302
-
303
-
304
-
305
-
306
-
307
-
308
-
309
-
310
-
311
-
312
-
313
-
314
-
315
-
316
-
317
-
318
-
319
-
320
-
321
-
322
-
323
-
324
-
325
-
326
-
327
-
328
-
329
-
330
-
331
-
332
-
333
-
334
-
335
-
336
-
337
-
338
-
339
-
340
-
341
-
342
-
343
-
344
-
345
-
346
-
347
-
348
-
349
-
350
-
351
-
352
-
353
-
354
-
355
-
356
-
357
-
358
-
359
-
360
-
361
-
362
-
363
-
364
-
365
-
366
-
367
-
368
-
369
-
370
-
371
-
372
-
373
-
374
-
375
-
376
-
377
-
378
-
379
-
380
-
381
-
382
-
383
-
384
-
385
-
386
-
387
-
388
-
389
-
390
-
391
-
392
-
393
-
394
-
395
-
396
-
397
-
398
-
399
-
400
-
401
-
402
-
403
-
404
-
405
-
406
-
407
-
408
-
409
-
410
-
411
-
412
-
413
-
414
-
415
-
416
-
417
-
418
-
419
-
420
-
421
-
422
-
423
-
424
-
425
-
426
-
427
-
428
-
429
-
430
-
431
-
432
-
433
-
434
-
435
-
436
-
437
-
438
-
439
-
440
-
441
-
442
-
443
-
444
-
445
-
446
-
447
-
448
-
449
-
450
-
451
-
452
-
453
-
454
-
455
-
456
-
457
-
458
 |
 |

125
In Latin America, the positive economic
environment encouraged growth in personal and
commercial lending, particularly in credit cards and
vehicle finance, which led to a 32 per cent increase
in net interest income. In Mexico, HSBC continued
to lead the market in personal customer deposit
growth. Recruitment of commercial customers was
also strong. A significant rise in customer acquisition
and the development of the Losango customer base
in Brazil also contributed.
Average interest-earning assets increased by
US$23 billion, or 2 per cent, compared with 2004.
At constant exchange rates, and excluding the
US$84.7 billion of trading assets in 2004, average
interest-earning assets increased by 11 per cent,
reflecting strong growth in mortgages, personal
lending and cards globally, and increased lending in
Commercial Banking.
HSBC’s net interest margin was 3.14 per cent in
2005 compared with 3.19 in 2004. For the reasons
set out in the opening paragraphs, these figures were
not strictly comparable as a result of presentation
changes under IFRSs from 1 January 2005.
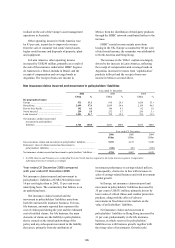
Net fee income
Year ended 31 December
2006 2005 2004
US$m % US$m % US$m %
By geographical region
Europe ...................................................... 7,108 41.4 6,299 43.6 5,980 46.2
Hong Kong .............................................. 2,056 12.0 1,674 11.6 1,703 13.2
Rest of Asia-Pacific ................................. 1,622 9.4 1,340 9.3 1,041 8.0
North America1 ........................................ 4,766 27.7 3,952 27.3 3,197 24.7
Latin America1 ......................................... 1,630 9.5 1,191 8.2 1,027 7.9
Net fee income ......................................... 17,182 100.0 14,456 100.0 12,948 100.0
Year ended 31 December
2006
US$m
2005
US$m
2004
US$m
Cards ................................................................................................................ 5,708 4,699 3,987
Account services .............................................................................................. 3,633 3,132 2,779
Funds under management ................................................................................ 2,718 1,831 1,479
Broking income ............................................................................................... 1,354 1,104 943
Insurance .......................................................................................................... 1,017 1,082 1,001
Credit facilities2 ............................................................................................... 922 880 1,179
Global custody ................................................................................................. 797 656 564
Imports/exports ................................................................................................ 780 722 692
Unit trusts ........................................................................................................ 520 388 498
Remittances ..................................................................................................... 472 396 353
Underwriting .................................................................................................... 286 274 234
Corporate finance ............................................................................................ 255 211 193
Trust income .................................................................................................... 248 199 203
Maintenance income on operating leases ........................................................ 122 180 190
Mortgage servicing .......................................................................................... 97 76 80
Other ................................................................................................................ 2,151 1,656 1,527
Total fee income .............................................................................................. 21,080 17,486 15,902
Less: fee expense ............................................................................................. (3,898) (3,030) (2,954)
Net fee income ................................................................................................. 17,182 14,456 12,948
1 In 2006, Mexico and Panama were reclassified from the North America segment to the Latin America segment. Comparative
information has been restated accordingly.
2 Under IFRSs from 2005, a higher proportion of fees on credit facilities is dealt with as part of an effective interest rate calculation than
previously. This change in accounting affects both the timing of fee income recognition and its presentation in the accounts. In
accordance with the transition arrangements to IFRSs, the 2004 comparative figure is presented on the previous accounting basis.
Year ended 31 December 2006 compared
with year ended 31 December 2005
Net fee income of US$17,182 million was 19 per
cent higher than in 2005, or 16 per cent higher on an
underlying basis. The commentary that follows is on
an underlying basis.
• Robust global stock market performance,
particularly in emerging markets, led to
increased customer appetite for equity-based