HSBC 2006 Annual Report Download - page 434
Download and view the complete annual report
Please find page 434 of the 2006 HSBC annual report below. You can navigate through the pages in the report by either clicking on the pages listed below, or by using the keyword search tool below to find specific information within the annual report.-
 1
1 -
2
-
3
-
4
-
5
-
6
-
7
-
8
-
9
-
10
-
11
-
12
-
13
-
14
-
15
-
16
-
17
-
18
-
19
-
20
-
21
-
22
-
23
-
24
-
25
-
26
-
27
-
28
-
29
-
30
-
31
-
32
-
33
-
34
-
35
-
36
-
37
-
38
-
39
-
40
-
41
-
42
-
43
-
44
-
45
-
46
-
47
-
48
-
49
-
50
-
51
-
52
-
53
-
54
-
55
-
56
-
57
-
58
-
59
-
60
-
61
-
62
-
63
-
64
-
65
-
66
-
67
-
68
-
69
-
70
-
71
-
72
-
73
-
74
-
75
-
76
-
77
-
78
-
79
-
80
-
81
-
82
-
83
-
84
-
85
-
86
-
87
-
88
-
89
-
90
-
91
-
92
-
93
-
94
-
95
-
96
-
97
-
98
-
99
-
100
-
101
-
102
-
103
-
104
-
105
-
106
-
107
-
108
-
109
-
110
-
111
-
112
-
113
-
114
-
115
-
116
-
117
-
118
-
119
-
120
-
121
-
122
-
123
-
124
-
125
-
126
-
127
-
128
-
129
-
130
-
131
-
132
-
133
-
134
-
135
-
136
-
137
-
138
-
139
-
140
-
141
-
142
-
143
-
144
-
145
-
146
-
147
-
148
-
149
-
150
-
151
-
152
-
153
-
154
-
155
-
156
-
157
-
158
-
159
-
160
-
161
-
162
-
163
-
164
-
165
-
166
-
167
-
168
-
169
-
170
-
171
-
172
-
173
-
174
-
175
-
176
-
177
-
178
-
179
-
180
-
181
-
182
-
183
-
184
-
185
-
186
-
187
-
188
-
189
-
190
-
191
-
192
-
193
-
194
-
195
-
196
-
197
-
198
-
199
-
200
-
201
-
202
-
203
-
204
-
205
-
206
-
207
-
208
-
209
-
210
-
211
-
212
-
213
-
214
-
215
-
216
-
217
-
218
-
219
-
220
-
221
-
222
-
223
-
224
-
225
-
226
-
227
-
228
-
229
-
230
-
231
-
232
-
233
-
234
-
235
-
236
-
237
-
238
-
239
-
240
-
241
-
242
-
243
-
244
-
245
-
246
-
247
-
248
-
249
-
250
-
251
-
252
-
253
-
254
-
255
-
256
-
257
-
258
-
259
-
260
-
261
-
262
-
263
-
264
-
265
-
266
-
267
-
268
-
269
-
270
-
271
-
272
-
273
-
274
-
275
-
276
-
277
-
278
-
279
-
280
-
281
-
282
-
283
-
284
-
285
-
286
-
287
-
288
-
289
-
290
-
291
-
292
-
293
-
294
-
295
-
296
-
297
-
298
-
299
-
300
-
301
-
302
-
303
-
304
-
305
-
306
-
307
-
308
-
309
-
310
-
311
-
312
-
313
-
314
-
315
-
316
-
317
-
318
-
319
-
320
-
321
-
322
-
323
-
324
-
325
-
326
-
327
-
328
-
329
-
330
-
331
-
332
-
333
-
334
-
335
-
336
-
337
-
338
-
339
-
340
-
341
-
342
-
343
-
344
-
345
-
346
-
347
-
348
-
349
-
350
-
351
-
352
-
353
-
354
-
355
-
356
-
357
-
358
-
359
-
360
-
361
-
362
-
363
-
364
-
365
-
366
-
367
-
368
-
369
-
370
-
371
-
372
-
373
-
374
-
375
-
376
-
377
-
378
-
379
-
380
-
381
-
382
-
383
-
384
-
385
-
386
-
387
-
388
-
389
-
390
-
391
-
392
-
393
-
394
-
395
-
396
-
397
-
398
-
399
-
400
-
401
-
402
-
403
-
404
-
405
-
406
-
407
-
408
-
409
-
410
-
411
-
412
-
413
-
414
-
415
-
416
-
417
-
418
-
419
-
420
-
421
-
422
-
423
-
 424
424 -
 425
425 -
 426
426 -
 427
427 -
 428
428 -
 429
429 -
 430
430 -
 431
431 -
 432
432 -
 433
433 -
 434
434 -
 435
435 -
 436
436 -
 437
437 -
 438
438 -
 439
439 -
 440
440 -
 441
441 -
 442
442 -
 443
443 -
 444
444 -
445
-
446
-
447
-
448
-
449
-
450
-
451
-
452
-
453
-
454
-
455
-
456
-
457
-
458
 |
 |

HSBC HOLDINGS PLC
Notes on the Financial Statements (continued)
Note 47
432
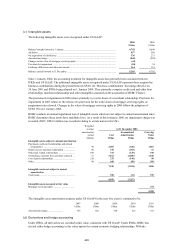
Vehicle
finance
Credit
card
Personal
non-credit
card
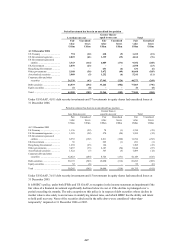
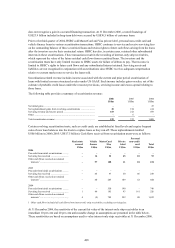
Carrying value (fair value) of interest-only strip receivables
(US$ millions) .................................................................................... (4) 9 1
Weighted average life (in years) ............................................................. 0.7 0.3 0.3
Payment speed assumption (annual rate) ................................................ 74.3% 98.9% 99.2%
Impact on fair value of 10% adverse change
(US$ millions) ................................................................................ – (1) –
Impact on fair value of 20% adverse change
(US$ millions) ................................................................................ (1) (2) –
Expected credit losses (annual rate) ....................................................... 10.0% 3.7% 9.8%
Impact on fair value of 10% adverse change
(US$ millions) ................................................................................ (2) – –
Impact on fair value of 20% adverse change
(US$ millions) ................................................................................ (3) (1) (1)
Discount rate for residual cash flows (annual rate) ................................ 10.0% 9.0% 11.0%
Impact on fair value of 10% adverse change
(US$ millions) ................................................................................ – – –
Impact on fair value of 20% adverse change
(US$ millions) ................................................................................ (1) – –
Variable returns to investors (annual rate) ............................................. – 4.7% 6.0%
Impact on fair value of 10% adverse change
(US$ millions) ................................................................................ – (1) –
Impact on fair value of 20% adverse change
(US$ millions) ................................................................................ – (1) (1)
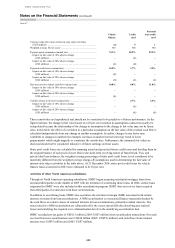
These sensitivities are hypothetical and should not be considered to be predictive of future performance. As the
figures indicate, the change in fair value based on a 10 per cent variation in assumptions cannot necessarily be
extrapolated because the relationship of the change in assumption to the change in fair value may not be linear.
Also, in this table, the effect of a variation in a particular assumption on the fair value of the residual cash flow is
calculated independently from any change in another assumption. In reality, changes in one factor may
contribute to changes in another (for example, increases in market interest rates may result in lower
prepayments) which might magnify or counteract the sensitivities. Furthermore, the estimated fair values as
disclosed should not be considered indicative of future earnings on these assets.
Static pool credit losses are calculated by summing actual and projected future credit losses and dividing them by
the original balance of each pool of asset. Due to the short-term revolving nature of MasterCard, Visa, and
private label loan balances, the weighted average percentage of static pool credit losses is not considered to be
materially different from the weighted average charge-off assumptions used in determining the fair value of
interest-only strip receivables in the table above. At 31 December 2006, static pool credit losses for vehicle
finance loans securitised in 2003 were estimated to be 10 per cent.
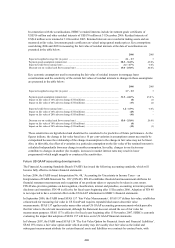
Activities of other North American subsidiaries
Through its North American operating subsidiaries, HSBC began acquiring residential mortgage loans from
unrelated third parties in the middle of 2005 with the intention of securitising those loans. In 2006, certain loans
originated by HSBC were also included in this securitisation program. HSBC does not service loans acquired
from third parties in connection with these securitisations.
In addition to securitising loans, HSBC also securitises the net interest margin (NIM) associated with certain
interests it retains from loan securitisations. A NIM securitisation is a structured finance transaction backed by
the cash flows on certain classes of retained interests in loan securitisations, primarily residual interests. The
notes issued in a NIM securitisation are collateralised by the excess spread left after absorbing any realised
losses and satisfying the required over collateralisation levels in the underlying securitisation deal.
HSBC recorded pre-tax gains of US$113 million (2005: US$3 million) from securitisation transactions. Proceeds
received from new securitisations were US$18 billion (2005: US$576 million), and cash flows from retained
interests were US$35 million and (2005: US$7 million).