HSBC 2006 Annual Report Download - page 357
Download and view the complete annual report
Please find page 357 of the 2006 HSBC annual report below. You can navigate through the pages in the report by either clicking on the pages listed below, or by using the keyword search tool below to find specific information within the annual report.-
 1
1 -
2
-
3
-
4
-
5
-
6
-
7
-
8
-
9
-
10
-
11
-
12
-
13
-
14
-
15
-
16
-
17
-
18
-
19
-
20
-
21
-
22
-
23
-
24
-
25
-
26
-
27
-
28
-
29
-
30
-
31
-
32
-
33
-
34
-
35
-
36
-
37
-
38
-
39
-
40
-
41
-
42
-
43
-
44
-
45
-
46
-
47
-
48
-
49
-
50
-
51
-
52
-
53
-
54
-
55
-
56
-
57
-
58
-
59
-
60
-
61
-
62
-
63
-
64
-
65
-
66
-
67
-
68
-
69
-
70
-
71
-
72
-
73
-
74
-
75
-
76
-
77
-
78
-
79
-
80
-
81
-
82
-
83
-
84
-
85
-
86
-
87
-
88
-
89
-
90
-
91
-
92
-
93
-
94
-
95
-
96
-
97
-
98
-
99
-
100
-
101
-
102
-
103
-
104
-
105
-
106
-
107
-
108
-
109
-
110
-
111
-
112
-
113
-
114
-
115
-
116
-
117
-
118
-
119
-
120
-
121
-
122
-
123
-
124
-
125
-
126
-
127
-
128
-
129
-
130
-
131
-
132
-
133
-
134
-
135
-
136
-
137
-
138
-
139
-
140
-
141
-
142
-
143
-
144
-
145
-
146
-
147
-
148
-
149
-
150
-
151
-
152
-
153
-
154
-
155
-
156
-
157
-
158
-
159
-
160
-
161
-
162
-
163
-
164
-
165
-
166
-
167
-
168
-
169
-
170
-
171
-
172
-
173
-
174
-
175
-
176
-
177
-
178
-
179
-
180
-
181
-
182
-
183
-
184
-
185
-
186
-
187
-
188
-
189
-
190
-
191
-
192
-
193
-
194
-
195
-
196
-
197
-
198
-
199
-
200
-
201
-
202
-
203
-
204
-
205
-
206
-
207
-
208
-
209
-
210
-
211
-
212
-
213
-
214
-
215
-
216
-
217
-
218
-
219
-
220
-
221
-
222
-
223
-
224
-
225
-
226
-
227
-
228
-
229
-
230
-
231
-
232
-
233
-
234
-
235
-
236
-
237
-
238
-
239
-
240
-
241
-
242
-
243
-
244
-
245
-
246
-
247
-
248
-
249
-
250
-
251
-
252
-
253
-
254
-
255
-
256
-
257
-
258
-
259
-
260
-
261
-
262
-
263
-
264
-
265
-
266
-
267
-
268
-
269
-
270
-
271
-
272
-
273
-
274
-
275
-
276
-
277
-
278
-
279
-
280
-
281
-
282
-
283
-
284
-
285
-
286
-
287
-
288
-
289
-
290
-
291
-
292
-
293
-
294
-
295
-
296
-
297
-
298
-
299
-
300
-
301
-
302
-
303
-
304
-
305
-
306
-
307
-
308
-
309
-
310
-
311
-
312
-
313
-
314
-
315
-
316
-
317
-
318
-
319
-
320
-
321
-
322
-
323
-
324
-
325
-
326
-
327
-
328
-
329
-
330
-
331
-
332
-
333
-
334
-
335
-
336
-
337
-
338
-
339
-
340
-
341
-
342
-
343
-
344
-
345
-
346
-
 347
347 -
 348
348 -
 349
349 -
 350
350 -
 351
351 -
 352
352 -
 353
353 -
 354
354 -
 355
355 -
 356
356 -
 357
357 -
 358
358 -
 359
359 -
 360
360 -
 361
361 -
 362
362 -
 363
363 -
 364
364 -
 365
365 -
 366
366 -
 367
367 -
368
-
369
-
370
-
371
-
372
-
373
-
374
-
375
-
376
-
377
-
378
-
379
-
380
-
381
-
382
-
383
-
384
-
385
-
386
-
387
-
388
-
389
-
390
-
391
-
392
-
393
-
394
-
395
-
396
-
397
-
398
-
399
-
400
-
401
-
402
-
403
-
404
-
405
-
406
-
407
-
408
-
409
-
410
-
411
-
412
-
413
-
414
-
415
-
416
-
417
-
418
-
419
-
420
-
421
-
422
-
423
-
424
-
425
-
426
-
427
-
428
-
429
-
430
-
431
-
432
-
433
-
434
-
435
-
436
-
437
-
438
-
439
-
440
-
441
-
442
-
443
-
444
-
445
-
446
-
447
-
448
-
449
-
450
-
451
-
452
-
453
-
454
-
455
-
456
-
457
-
458
 |
 |

355
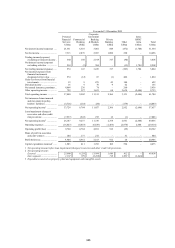
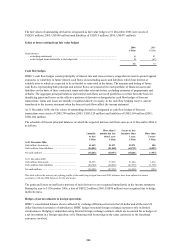
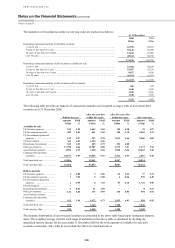
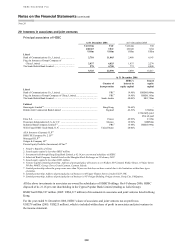
The fair values of outstanding derivatives designated as fair value hedges at 31 December 2006 were assets of
US$201 million (2005: US$149 million) and liabilities of US$315 million (2005: US$471 million).
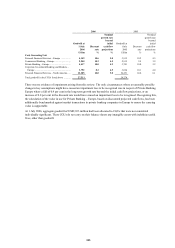
Gains or losses arising from fair value hedges
2006
2005
US$m US$m
Gains/(losses):
– on hedging instruments ............................................................................................................. 8 81
– on the hedged items attributable to the hedged risk ................................................................. 8 (67)
16 14
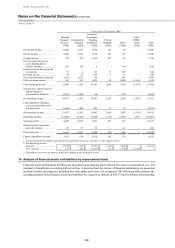
Cash flow hedges
HSBC’s cash flow hedges consist principally of interest rate and cross-currency swaps that are used to protect against
exposures to variability in future interest cash flows on non-trading assets and liabilities which bear interest at
variable rates or which are expected to be re-funded or reinvested in the future. The amounts and timing of future
cash flows, representing both principal and interest flows, are projected for each portfolio of financial assets and
liabilities on the basis of their contractual terms and other relevant factors, including estimates of prepayments and
defaults. The aggregate principal balances and interest cash flows across all portfolios over time form the basis for
identifying gains and losses on the effective portions of derivatives designated as cash flow hedges of forecast
transactions. Gains and losses are initially recognised directly in equity, in the cash flow hedging reserve, and are
transferred to the income statement when the forecast cash flows affect the income statement.
At 31 December 2006, the fair values of outstanding derivatives designated as cash flow hedges of forecast
transactions were assets of US$3,749 million (2005: US$3,528 million) and liabilities of US$1,364 million (2005:
US$1,062 million).
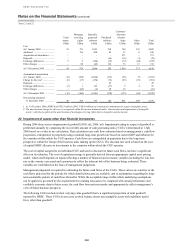
The schedule of forecast principal balances on which the expected interest cash flows arise as at 31 December 2006 is
as follows:
3 months
or less
More than 3
months but less
than 1 year
5 years or less
but more than
1 year
More than
5 years
US$m US$m US$m US$m
At 31 December 2006
Cash inflows from assets .............................................. 61,649 51,471 22,271 496
Cash outflows from liabilities ...................................... (96,852) (91,868) (60,712) (8,093)
Net cash outflows ......................................................... (35,203) (40,397) (38,441) (7,597)
At 31 December 2005
Cash inflows from assets .............................................. 54,355 37,270 31,664 1,474
Cash outflows from liabilities ...................................... (80,744) (64,622) (47,918) (1,799)
Net cash outflows ......................................................... (26,389) (27,352) (16,254) (325)
This table reflects the interest rate refixing profile of the underlying hedged items and 2005 balances have been adjusted to ensure
consistency with the 2006 balances for this disclosure.
The gains and losses on ineffective portions of such derivatives are recognised immediately in the income statement.
During the year to 31 December 2006, a loss of US$122 million (2005: US$96 million) was recognised due to hedge
ineffectiveness.
Hedges of net investments in foreign operations
HSBC’s consolidated balance sheet is affected by exchange differences between the US dollar and all the non-US
dollar functional currencies of subsidiaries. HSBC hedges structural foreign exchange exposures only in limited
circumstances. Hedging is undertaken using forward foreign exchange contracts which are accounted for as hedges of
a net investment in a foreign operation, or by financing with borrowings in the same currencies as the functional
currencies involved.