HSBC 2006 Annual Report Download - page 207
Download and view the complete annual report
Please find page 207 of the 2006 HSBC annual report below. You can navigate through the pages in the report by either clicking on the pages listed below, or by using the keyword search tool below to find specific information within the annual report.-
 1
1 -
2
-
3
-
4
-
5
-
6
-
7
-
8
-
9
-
10
-
11
-
12
-
13
-
14
-
15
-
16
-
17
-
18
-
19
-
20
-
21
-
22
-
23
-
24
-
25
-
26
-
27
-
28
-
29
-
30
-
31
-
32
-
33
-
34
-
35
-
36
-
37
-
38
-
39
-
40
-
41
-
42
-
43
-
44
-
45
-
46
-
47
-
48
-
49
-
50
-
51
-
52
-
53
-
54
-
55
-
56
-
57
-
58
-
59
-
60
-
61
-
62
-
63
-
64
-
65
-
66
-
67
-
68
-
69
-
70
-
71
-
72
-
73
-
74
-
75
-
76
-
77
-
78
-
79
-
80
-
81
-
82
-
83
-
84
-
85
-
86
-
87
-
88
-
89
-
90
-
91
-
92
-
93
-
94
-
95
-
96
-
97
-
98
-
99
-
100
-
101
-
102
-
103
-
104
-
105
-
106
-
107
-
108
-
109
-
110
-
111
-
112
-
113
-
114
-
115
-
116
-
117
-
118
-
119
-
120
-
121
-
122
-
123
-
124
-
125
-
126
-
127
-
128
-
129
-
130
-
131
-
132
-
133
-
134
-
135
-
136
-
137
-
138
-
139
-
140
-
141
-
142
-
143
-
144
-
145
-
146
-
147
-
148
-
149
-
150
-
151
-
152
-
153
-
154
-
155
-
156
-
157
-
158
-
159
-
160
-
161
-
162
-
163
-
164
-
165
-
166
-
167
-
168
-
169
-
170
-
171
-
172
-
173
-
174
-
175
-
176
-
177
-
178
-
179
-
180
-
181
-
182
-
183
-
184
-
185
-
186
-
187
-
188
-
189
-
190
-
191
-
192
-
193
-
194
-
195
-
196
-
 197
197 -
 198
198 -
 199
199 -
 200
200 -
 201
201 -
 202
202 -
 203
203 -
 204
204 -
 205
205 -
 206
206 -
 207
207 -
 208
208 -
 209
209 -
 210
210 -
 211
211 -
 212
212 -
 213
213 -
 214
214 -
 215
215 -
 216
216 -
 217
217 -
218
-
219
-
220
-
221
-
222
-
223
-
224
-
225
-
226
-
227
-
228
-
229
-
230
-
231
-
232
-
233
-
234
-
235
-
236
-
237
-
238
-
239
-
240
-
241
-
242
-
243
-
244
-
245
-
246
-
247
-
248
-
249
-
250
-
251
-
252
-
253
-
254
-
255
-
256
-
257
-
258
-
259
-
260
-
261
-
262
-
263
-
264
-
265
-
266
-
267
-
268
-
269
-
270
-
271
-
272
-
273
-
274
-
275
-
276
-
277
-
278
-
279
-
280
-
281
-
282
-
283
-
284
-
285
-
286
-
287
-
288
-
289
-
290
-
291
-
292
-
293
-
294
-
295
-
296
-
297
-
298
-
299
-
300
-
301
-
302
-
303
-
304
-
305
-
306
-
307
-
308
-
309
-
310
-
311
-
312
-
313
-
314
-
315
-
316
-
317
-
318
-
319
-
320
-
321
-
322
-
323
-
324
-
325
-
326
-
327
-
328
-
329
-
330
-
331
-
332
-
333
-
334
-
335
-
336
-
337
-
338
-
339
-
340
-
341
-
342
-
343
-
344
-
345
-
346
-
347
-
348
-
349
-
350
-
351
-
352
-
353
-
354
-
355
-
356
-
357
-
358
-
359
-
360
-
361
-
362
-
363
-
364
-
365
-
366
-
367
-
368
-
369
-
370
-
371
-
372
-
373
-
374
-
375
-
376
-
377
-
378
-
379
-
380
-
381
-
382
-
383
-
384
-
385
-
386
-
387
-
388
-
389
-
390
-
391
-
392
-
393
-
394
-
395
-
396
-
397
-
398
-
399
-
400
-
401
-
402
-
403
-
404
-
405
-
406
-
407
-
408
-
409
-
410
-
411
-
412
-
413
-
414
-
415
-
416
-
417
-
418
-
419
-
420
-
421
-
422
-
423
-
424
-
425
-
426
-
427
-
428
-
429
-
430
-
431
-
432
-
433
-
434
-
435
-
436
-
437
-
438
-
439
-
440
-
441
-
442
-
443
-
444
-
445
-
446
-
447
-
448
-
449
-
450
-
451
-
452
-
453
-
454
-
455
-
456
-
457
-
458
 |
 |

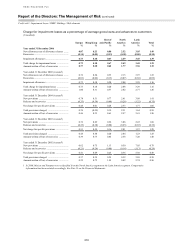
205
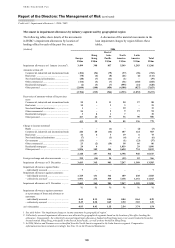
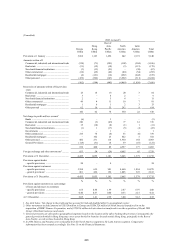
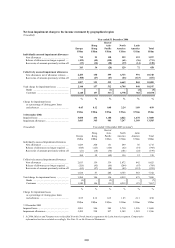
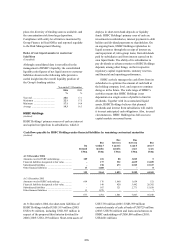
(Unaudited)
Year ended 31 December 2002 (restated1)
Europe
US$m
Hong Kong
US$m
Rest of
Asia-
Pacific
US$m
North
America
US$m
Latin
America
US$m
Total
US$m
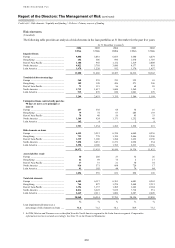
Specific provisions
New provisions ............................................... 963 528 400 380 407 2,678
Release of provisions no longer required ...... (271) (160) (268) (72) (55) (826)
Recoveries of amounts previously written off (58) (25) (52) (35) (10) (180)
634 343 80 273 342 1,672
General provisions
Argentine additional provision ........................... – – – – (196) (196)
Other ................................................................... (65) (97) 9 (32) 30 (155)
(65) (97) 9 (32) (166) (351)
Total bad and doubtful debt charge .................... 569 246 89 241 176 1,321
Customers ....................................................... 569 246 89 241 176 1,321
% % % % % %
Bad and doubtful debt charge
as a percentage of closing gross loans
and advances .................................................. 0.34 0.35 0.23 0.32 0.83 0.36
US$m US$m US$m US$m US$m US$m
31 December 2002
Non-performing loans ........................................ 4,495 1,724 2,055 508 1,741 10,523
Provisions ........................................................... 3,645 1,143 1,496 642 2,191 9,117
1 In 2006, Mexico and Panama were reclassified from the North America segment to the Latin America segment. Comparative
information has been restated accordingly. See Note 13 on the Financial Statements.
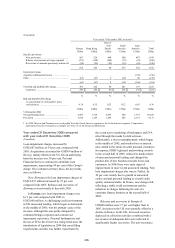
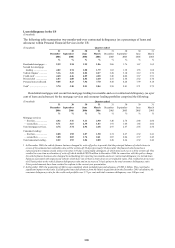
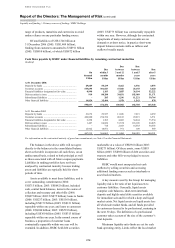
Year ended 31 December 2006 compared
with year ended 31 December 2005
(Unaudited)
Loan impairment charges increased by
US$2,687 million, or 34 per cent, compared with
2005. Acquisitions accounted for US$309 million of
the rise, mainly Metris in the US. On an underlying
basis the increase was 30 per cent. Personal
Financial Services continued to dominate loan
impairments, representing 94 per cent of the Group’s
charge. On a constant currency basis, the key trends
were as follows.
New allowances for loan impairment charges of
US$12,037 million increased by 27 per cent
compared with 2005. Releases and recoveries of
allowances were broadly in line with 2005.
In Europe, new loan impairment charges rose
by 9 per cent compared with 2005 to
US$3,000 million. A challenging credit environment
in UK unsecured lending, which began to deteriorate
in the middle of 2005, was the primary cause of the
increase, although this was partly mitigated by
continued benign corporate and commercial
impairment experience. Personal bankruptcies and
the use of IVAs have been on a rising trend since the
introduction of legislation in 2004 that eased filing
requirements, and this was further exacerbated by
the recent active marketing of bankruptcy and IVA
relief through the media by debt advisors.
Additionally, a rise in unemployment, which began
in the middle of 2005, and modest rises in interest
rates added to the strain on some personal customers.
In response, HSBC tightened underwriting controls
in the second half of 2005, reduced its market share
of unsecured personal lending and changed the
product mix of new business towards lower-risk
customers. In 2006 there were early signs of
improvement in more recent unsecured lending. New
loan impairment charges also rose in Turkey, by
30 per cent, mainly due to growth in unsecured
credit card and personal lending as overall credit
quality remained stable. In France, new charges fell,
reflecting a stable credit environment and the
reduction in charges following the sale of a
consumer finance business in the second half of
2005.
Releases and recoveries in Europe of
US$860 million were 17 per cent higher than in
2005. Increases in the UK were partially offset by a
decline in France. In the UK, increased resources
deployed on collection activities combined with a
rise in sales of delinquent debt were reflected in
significantly higher recoveries. The non-recurrence