HSBC 2006 Annual Report Download - page 206
Download and view the complete annual report
Please find page 206 of the 2006 HSBC annual report below. You can navigate through the pages in the report by either clicking on the pages listed below, or by using the keyword search tool below to find specific information within the annual report.-
 1
1 -
2
-
3
-
4
-
5
-
6
-
7
-
8
-
9
-
10
-
11
-
12
-
13
-
14
-
15
-
16
-
17
-
18
-
19
-
20
-
21
-
22
-
23
-
24
-
25
-
26
-
27
-
28
-
29
-
30
-
31
-
32
-
33
-
34
-
35
-
36
-
37
-
38
-
39
-
40
-
41
-
42
-
43
-
44
-
45
-
46
-
47
-
48
-
49
-
50
-
51
-
52
-
53
-
54
-
55
-
56
-
57
-
58
-
59
-
60
-
61
-
62
-
63
-
64
-
65
-
66
-
67
-
68
-
69
-
70
-
71
-
72
-
73
-
74
-
75
-
76
-
77
-
78
-
79
-
80
-
81
-
82
-
83
-
84
-
85
-
86
-
87
-
88
-
89
-
90
-
91
-
92
-
93
-
94
-
95
-
96
-
97
-
98
-
99
-
100
-
101
-
102
-
103
-
104
-
105
-
106
-
107
-
108
-
109
-
110
-
111
-
112
-
113
-
114
-
115
-
116
-
117
-
118
-
119
-
120
-
121
-
122
-
123
-
124
-
125
-
126
-
127
-
128
-
129
-
130
-
131
-
132
-
133
-
134
-
135
-
136
-
137
-
138
-
139
-
140
-
141
-
142
-
143
-
144
-
145
-
146
-
147
-
148
-
149
-
150
-
151
-
152
-
153
-
154
-
155
-
156
-
157
-
158
-
159
-
160
-
161
-
162
-
163
-
164
-
165
-
166
-
167
-
168
-
169
-
170
-
171
-
172
-
173
-
174
-
175
-
176
-
177
-
178
-
179
-
180
-
181
-
182
-
183
-
184
-
185
-
186
-
187
-
188
-
189
-
190
-
191
-
192
-
193
-
194
-
195
-
 196
196 -
 197
197 -
 198
198 -
 199
199 -
 200
200 -
 201
201 -
 202
202 -
 203
203 -
 204
204 -
 205
205 -
 206
206 -
 207
207 -
 208
208 -
 209
209 -
 210
210 -
 211
211 -
 212
212 -
 213
213 -
 214
214 -
 215
215 -
 216
216 -
217
-
218
-
219
-
220
-
221
-
222
-
223
-
224
-
225
-
226
-
227
-
228
-
229
-
230
-
231
-
232
-
233
-
234
-
235
-
236
-
237
-
238
-
239
-
240
-
241
-
242
-
243
-
244
-
245
-
246
-
247
-
248
-
249
-
250
-
251
-
252
-
253
-
254
-
255
-
256
-
257
-
258
-
259
-
260
-
261
-
262
-
263
-
264
-
265
-
266
-
267
-
268
-
269
-
270
-
271
-
272
-
273
-
274
-
275
-
276
-
277
-
278
-
279
-
280
-
281
-
282
-
283
-
284
-
285
-
286
-
287
-
288
-
289
-
290
-
291
-
292
-
293
-
294
-
295
-
296
-
297
-
298
-
299
-
300
-
301
-
302
-
303
-
304
-
305
-
306
-
307
-
308
-
309
-
310
-
311
-
312
-
313
-
314
-
315
-
316
-
317
-
318
-
319
-
320
-
321
-
322
-
323
-
324
-
325
-
326
-
327
-
328
-
329
-
330
-
331
-
332
-
333
-
334
-
335
-
336
-
337
-
338
-
339
-
340
-
341
-
342
-
343
-
344
-
345
-
346
-
347
-
348
-
349
-
350
-
351
-
352
-
353
-
354
-
355
-
356
-
357
-
358
-
359
-
360
-
361
-
362
-
363
-
364
-
365
-
366
-
367
-
368
-
369
-
370
-
371
-
372
-
373
-
374
-
375
-
376
-
377
-
378
-
379
-
380
-
381
-
382
-
383
-
384
-
385
-
386
-
387
-
388
-
389
-
390
-
391
-
392
-
393
-
394
-
395
-
396
-
397
-
398
-
399
-
400
-
401
-
402
-
403
-
404
-
405
-
406
-
407
-
408
-
409
-
410
-
411
-
412
-
413
-
414
-
415
-
416
-
417
-
418
-
419
-
420
-
421
-
422
-
423
-
424
-
425
-
426
-
427
-
428
-
429
-
430
-
431
-
432
-
433
-
434
-
435
-
436
-
437
-
438
-
439
-
440
-
441
-
442
-
443
-
444
-
445
-
446
-
447
-
448
-
449
-
450
-
451
-
452
-
453
-
454
-
455
-
456
-
457
-
458
 |
 |

HSBC HOLDINGS PLC
Report of the Directors: The Management of Risk (continued)
Credit risk > Charge to P&L Account > 2004 to 2002 / Impairment charges > 2006
204
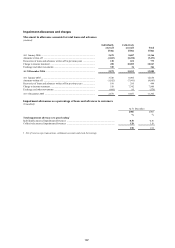
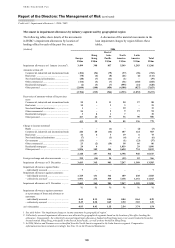
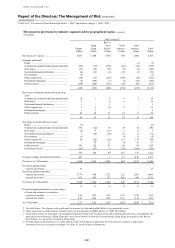
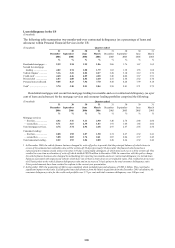
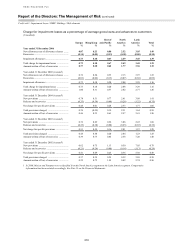
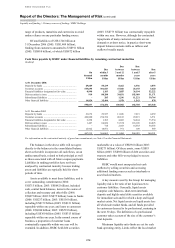
Net charge to the profit and loss account for bad and doubtful debts by geographical region (continued)
(Unaudited)
Year ended 31 December 2004 (restated1)
Europe
US$m
Hong
Kong
US$m
Rest of
Asia-
Pacific
US$m
North
America
US$m
Latin
America
US$m
Total
US$m
Specific provisions
New provisions ............................................... 2,047 237 419 5,690 479 8,872
Release of provisions no longer required ...... (726) (187) (199) (105) (49) (1,266)
Recoveries of amounts previously written off (136) (47) (70) (504) (156) (913)
1,185 3 150 5,081 274 6,693
General provisions .............................................. (162) (223) (48) (63) (2) (498)
Total bad and doubtful debt charge .................... 1,023 (220) 102 5,018 272 6,195
Banks ............................................................. (7) – (1) – (2) (10)
Customers ...................................................... 1,030 (220) 103 5,018 274 6,205
% % % % % %
Bad and doubtful debt charge
as a percentage of closing gross loans
and advances .................................................. 0.36 (0.28) 0.17 1.88 1.20 0.91
US$m US$m US$m US$m US$m US$m
31 December 2004
Non-performing loans ........................................ 6,039 696 1,160 3,555 977 12,427
Provisions ........................................................... 4,798 522 940 5,212 1,070 12,542
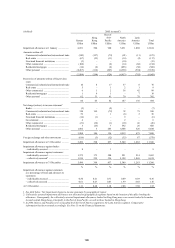
(Unaudited)
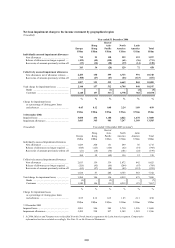
Year ended 31 December 2003 (restated1)
Europe
US$m
Hong Kong
US$m
Rest of
Asia-
Pacific
US$m
North
America
US$m
Latin
America
US$m
Total
US$m
Specific provisions
New provisions ............................................... 1,485 655 412 4,907 318 7,777
Release of provisions no longer required ...... (351) (182) (269) (80) (71) (953)
Recoveries of amounts previously written off (142) (42) (74) (329) (23) (610)
992 431 69 4,498 224 6,214
General provisions .............................................. (118) (31) 16 59 (47) (121)
Total bad and doubtful debt charge .................... 874 400 85 4,557 177 6,093
Banks ............................................................. (6) – 3 – – (3)
Customers ...................................................... 880 400 82 4,557 177 6,096
% % % % % %
Bad and doubtful debt charge
as a percentage of closing gross loans
and advances .................................................. 0.41 0.53 0.17 2.33 0.79 1.12
US$m US$m US$m US$m US$m US$m
31 December 2003
Non-performing loans ........................................ 5,701 1,671 1,538 4,889 1,251 15,050
Provisions ........................................................... 4,415 1,055 1,177 5,665 1,379 13,691
1 In 2006, Mexico and Panama were reclassified from the North America segment to the Latin America segment. Comparative
information has been restated accordingly. See Note 13 on the Financial Statements.