HSBC 2006 Annual Report Download - page 26
Download and view the complete annual report
Please find page 26 of the 2006 HSBC annual report below. You can navigate through the pages in the report by either clicking on the pages listed below, or by using the keyword search tool below to find specific information within the annual report.-
 1
1 -
2
-
3
-
4
-
5
-
6
-
7
-
8
-
9
-
10
-
11
-
12
-
13
-
14
-
15
-
 16
16 -
 17
17 -
 18
18 -
 19
19 -
 20
20 -
 21
21 -
 22
22 -
 23
23 -
 24
24 -
 25
25 -
 26
26 -
 27
27 -
 28
28 -
 29
29 -
 30
30 -
 31
31 -
 32
32 -
 33
33 -
 34
34 -
 35
35 -
 36
36 -
37
-
38
-
39
-
40
-
41
-
42
-
43
-
44
-
45
-
46
-
47
-
48
-
49
-
50
-
51
-
52
-
53
-
54
-
55
-
56
-
57
-
58
-
59
-
60
-
61
-
62
-
63
-
64
-
65
-
66
-
67
-
68
-
69
-
70
-
71
-
72
-
73
-
74
-
75
-
76
-
77
-
78
-
79
-
80
-
81
-
82
-
83
-
84
-
85
-
86
-
87
-
88
-
89
-
90
-
91
-
92
-
93
-
94
-
95
-
96
-
97
-
98
-
99
-
100
-
101
-
102
-
103
-
104
-
105
-
106
-
107
-
108
-
109
-
110
-
111
-
112
-
113
-
114
-
115
-
116
-
117
-
118
-
119
-
120
-
121
-
122
-
123
-
124
-
125
-
126
-
127
-
128
-
129
-
130
-
131
-
132
-
133
-
134
-
135
-
136
-
137
-
138
-
139
-
140
-
141
-
142
-
143
-
144
-
145
-
146
-
147
-
148
-
149
-
150
-
151
-
152
-
153
-
154
-
155
-
156
-
157
-
158
-
159
-
160
-
161
-
162
-
163
-
164
-
165
-
166
-
167
-
168
-
169
-
170
-
171
-
172
-
173
-
174
-
175
-
176
-
177
-
178
-
179
-
180
-
181
-
182
-
183
-
184
-
185
-
186
-
187
-
188
-
189
-
190
-
191
-
192
-
193
-
194
-
195
-
196
-
197
-
198
-
199
-
200
-
201
-
202
-
203
-
204
-
205
-
206
-
207
-
208
-
209
-
210
-
211
-
212
-
213
-
214
-
215
-
216
-
217
-
218
-
219
-
220
-
221
-
222
-
223
-
224
-
225
-
226
-
227
-
228
-
229
-
230
-
231
-
232
-
233
-
234
-
235
-
236
-
237
-
238
-
239
-
240
-
241
-
242
-
243
-
244
-
245
-
246
-
247
-
248
-
249
-
250
-
251
-
252
-
253
-
254
-
255
-
256
-
257
-
258
-
259
-
260
-
261
-
262
-
263
-
264
-
265
-
266
-
267
-
268
-
269
-
270
-
271
-
272
-
273
-
274
-
275
-
276
-
277
-
278
-
279
-
280
-
281
-
282
-
283
-
284
-
285
-
286
-
287
-
288
-
289
-
290
-
291
-
292
-
293
-
294
-
295
-
296
-
297
-
298
-
299
-
300
-
301
-
302
-
303
-
304
-
305
-
306
-
307
-
308
-
309
-
310
-
311
-
312
-
313
-
314
-
315
-
316
-
317
-
318
-
319
-
320
-
321
-
322
-
323
-
324
-
325
-
326
-
327
-
328
-
329
-
330
-
331
-
332
-
333
-
334
-
335
-
336
-
337
-
338
-
339
-
340
-
341
-
342
-
343
-
344
-
345
-
346
-
347
-
348
-
349
-
350
-
351
-
352
-
353
-
354
-
355
-
356
-
357
-
358
-
359
-
360
-
361
-
362
-
363
-
364
-
365
-
366
-
367
-
368
-
369
-
370
-
371
-
372
-
373
-
374
-
375
-
376
-
377
-
378
-
379
-
380
-
381
-
382
-
383
-
384
-
385
-
386
-
387
-
388
-
389
-
390
-
391
-
392
-
393
-
394
-
395
-
396
-
397
-
398
-
399
-
400
-
401
-
402
-
403
-
404
-
405
-
406
-
407
-
408
-
409
-
410
-
411
-
412
-
413
-
414
-
415
-
416
-
417
-
418
-
419
-
420
-
421
-
422
-
423
-
424
-
425
-
426
-
427
-
428
-
429
-
430
-
431
-
432
-
433
-
434
-
435
-
436
-
437
-
438
-
439
-
440
-
441
-
442
-
443
-
444
-
445
-
446
-
447
-
448
-
449
-
450
-
451
-
452
-
453
-
454
-
455
-
456
-
457
-
458
 |
 |

HSBC HOLDINGS PLC
Report of the Directors: Business Review (continued)
Customer groups > Profit/(loss) before tax
24
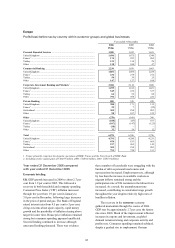
Profit/(loss) before tax (continued)
Year ended 31 December 2005
Total
Personal
Financial
Services
US$m
Commercial
Banking
US$m
Corporate,
Investment
Banking &
Markets
US$m
Private
Banking
US$m
Other6
US$m
Inter-
segment
elimination
US$m
Total
US$m
Net interest income/(expense) .... 23,351 6,310 3,001 848 (472) (1,704) 31,334
Net fee income ............................ 7,313 2,876 2,967 1,080 220 – 14,456
Trading income/(expense)
excluding net interest income 360 150 2,919 317 (90) – 3,656
Net interest income/ (expense)
on trading activities ................ 214 (3) 306 – (13) 1,704 2,208
Net trading income/(expense)1 ... 574 147 3,225 317 (103) 1,704 5,864
Net income/(expense) from
financial instruments
designated at fair value ........... 574 (12) 67 (1) 406 – 1,034
Gains less losses from
financial investments .............. 19 9 475 45 144 – 692
Dividend income ......................... 16 9 79 9 42 – 155
Net earned insurance premiums . 4,864 236 76 – 260 – 5,436
Other operating income .............. 729 327 1,621 68 2,634 (2,646) 2,733
Total operating income ............... 37,440 9,902 11,511 2,366 3,131 (2,646) 61,704
Net insurance claims2 ................. (3,716) (118) (54) – (179) – (4,067)
Net operating income3 ................ 33,724 9,784 11,457 2,366 2,952 (2,646) 57,637
Loan impairment (charges)/
recoveries and other credit
risk provisions ........................ (7,537) (547) 272 12 (1) – (7,801)
Net operating income ................. 26,187 9,237 11,729 2,378 2,951 (2,646) 49,836
Total operating expenses ............ (16,427) (4,453) (6,838) (1,466) (2,976) 2,646 (29,514)
Operating profit/(loss) ................ 9,760 4,784 4,891 912 (25) – 20,322
Share of profit in associates
and joint ventures ................... 144 177 272 – 51 – 644
Profit before tax .......................... 9,904 4,961 5,163 912 26 – 20,966
% % % % % %
Share of HSBC’s profit before
tax ........................................... 47.2 23.7 24.6 4.4 0.1 100.0
Cost efficiency ratio ................... 48.7 45.5 59.7 62.0 100.8 51.2
US$m US$m US$m US$m US$m US$m
Selected balance sheet data5
Loans and advances to
customers (net) ....................... 398,884 142,041 169,435 27,749 1,893 740,002
Total assets ................................. 484,314 175,120 755,056 59,827 27,653 1,501,970
Customer accounts ...................... 321,240 148,106 202,361 67,205 507 739,419
The following assets and
liabilities were significant
to Corporate, Investment
Banking and Markets:
– loans and advances to
banks (net) .......................... 106,123
– trading assets, financial
assets designated at fair
value, and financial
investments ......................... 373,787
– deposits by banks ............... 65,853
For footnotes, see page 26.