HSBC 2006 Annual Report Download - page 149
Download and view the complete annual report
Please find page 149 of the 2006 HSBC annual report below. You can navigate through the pages in the report by either clicking on the pages listed below, or by using the keyword search tool below to find specific information within the annual report.-
 1
1 -
2
-
3
-
4
-
5
-
6
-
7
-
8
-
9
-
10
-
11
-
12
-
13
-
14
-
15
-
16
-
17
-
18
-
19
-
20
-
21
-
22
-
23
-
24
-
25
-
26
-
27
-
28
-
29
-
30
-
31
-
32
-
33
-
34
-
35
-
36
-
37
-
38
-
39
-
40
-
41
-
42
-
43
-
44
-
45
-
46
-
47
-
48
-
49
-
50
-
51
-
52
-
53
-
54
-
55
-
56
-
57
-
58
-
59
-
60
-
61
-
62
-
63
-
64
-
65
-
66
-
67
-
68
-
69
-
70
-
71
-
72
-
73
-
74
-
75
-
76
-
77
-
78
-
79
-
80
-
81
-
82
-
83
-
84
-
85
-
86
-
87
-
88
-
89
-
90
-
91
-
92
-
93
-
94
-
95
-
96
-
97
-
98
-
99
-
100
-
101
-
102
-
103
-
104
-
105
-
106
-
107
-
108
-
109
-
110
-
111
-
112
-
113
-
114
-
115
-
116
-
117
-
118
-
119
-
120
-
121
-
122
-
123
-
124
-
125
-
126
-
127
-
128
-
129
-
130
-
131
-
132
-
133
-
134
-
135
-
136
-
137
-
138
-
 139
139 -
 140
140 -
 141
141 -
 142
142 -
 143
143 -
 144
144 -
 145
145 -
 146
146 -
 147
147 -
 148
148 -
 149
149 -
 150
150 -
 151
151 -
 152
152 -
 153
153 -
 154
154 -
 155
155 -
 156
156 -
 157
157 -
 158
158 -
 159
159 -
160
-
161
-
162
-
163
-
164
-
165
-
166
-
167
-
168
-
169
-
170
-
171
-
172
-
173
-
174
-
175
-
176
-
177
-
178
-
179
-
180
-
181
-
182
-
183
-
184
-
185
-
186
-
187
-
188
-
189
-
190
-
191
-
192
-
193
-
194
-
195
-
196
-
197
-
198
-
199
-
200
-
201
-
202
-
203
-
204
-
205
-
206
-
207
-
208
-
209
-
210
-
211
-
212
-
213
-
214
-
215
-
216
-
217
-
218
-
219
-
220
-
221
-
222
-
223
-
224
-
225
-
226
-
227
-
228
-
229
-
230
-
231
-
232
-
233
-
234
-
235
-
236
-
237
-
238
-
239
-
240
-
241
-
242
-
243
-
244
-
245
-
246
-
247
-
248
-
249
-
250
-
251
-
252
-
253
-
254
-
255
-
256
-
257
-
258
-
259
-
260
-
261
-
262
-
263
-
264
-
265
-
266
-
267
-
268
-
269
-
270
-
271
-
272
-
273
-
274
-
275
-
276
-
277
-
278
-
279
-
280
-
281
-
282
-
283
-
284
-
285
-
286
-
287
-
288
-
289
-
290
-
291
-
292
-
293
-
294
-
295
-
296
-
297
-
298
-
299
-
300
-
301
-
302
-
303
-
304
-
305
-
306
-
307
-
308
-
309
-
310
-
311
-
312
-
313
-
314
-
315
-
316
-
317
-
318
-
319
-
320
-
321
-
322
-
323
-
324
-
325
-
326
-
327
-
328
-
329
-
330
-
331
-
332
-
333
-
334
-
335
-
336
-
337
-
338
-
339
-
340
-
341
-
342
-
343
-
344
-
345
-
346
-
347
-
348
-
349
-
350
-
351
-
352
-
353
-
354
-
355
-
356
-
357
-
358
-
359
-
360
-
361
-
362
-
363
-
364
-
365
-
366
-
367
-
368
-
369
-
370
-
371
-
372
-
373
-
374
-
375
-
376
-
377
-
378
-
379
-
380
-
381
-
382
-
383
-
384
-
385
-
386
-
387
-
388
-
389
-
390
-
391
-
392
-
393
-
394
-
395
-
396
-
397
-
398
-
399
-
400
-
401
-
402
-
403
-
404
-
405
-
406
-
407
-
408
-
409
-
410
-
411
-
412
-
413
-
414
-
415
-
416
-
417
-
418
-
419
-
420
-
421
-
422
-
423
-
424
-
425
-
426
-
427
-
428
-
429
-
430
-
431
-
432
-
433
-
434
-
435
-
436
-
437
-
438
-
439
-
440
-
441
-
442
-
443
-
444
-
445
-
446
-
447
-
448
-
449
-
450
-
451
-
452
-
453
-
454
-
455
-
456
-
457
-
458
 |
 |

147
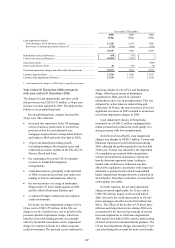
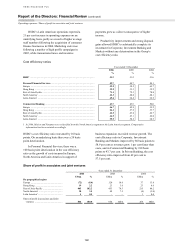
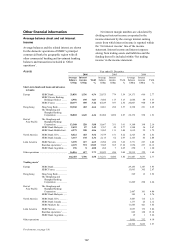
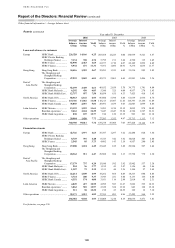
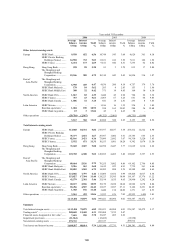
Other financial information
Average balance sheet and net interest
income
Average balances and the related interest are shown
for the domestic operations of HSBC’s principal
commercial banks by geographic region with all
other commercial banking and investment banking
balances and transactions included in ‘Other
operations’.
Net interest margin numbers are calculated by
dividing net interest income as reported in the
income statement by the average interest earning
assets from which interest income is reported within
the ‘Net interest income’ line of the income
statement. Interest income and interest expense
arising from trading assets and liabilities and the
funding thereof is included within ‘Net trading
income’ in the income statement.
Assets Year ended 31 December
2006 2005 2004
Average
balance
Interest
income Yield
Average
balance
Interest
income Yield
Average
balance
Interest
income Yield
US$m US$m % US$m US$m % US$m US$m %
Short-term funds and loans and advances
to banks
Europe HSBC Bank ...................... 33,856 1,536 4.54 21,875 774 3.54 24,173 669 2.77
HSBC Private Banking
Holdings (Suisse) ......... 4,956 190 3.83 3,606 113 3.13
2,644 89 3.37
HSBC France ................... 20,197 690 3.42 16,829 387 2.30 26,007 960 3.69
Hong Kong Hang Seng Bank ............... 10,360 483 4.66 8,061 288 3.57 8,328 221 2.65
The Hongkong and
Shanghai Banking
Corporation .................. 38,802 1,645 4.24 36,904 1,058 2.87
28,172 538 1.91
Rest of
Asia-Pacific
The Hongkong and
Shanghai Banking
Corporation .................. 13,388 520 3.88 11,667 351 3.01
9,180 198 2.16
HSBC Bank Malaysia ...... 2,492 87 3.49 1,767 49 2.77 1,348 36 2.67
HSBC Bank Middle East . 4,279 208 4.86 3,262 111 3.40 1,619 29 1.79
North America HSBC Bank USA ............ . 8,422 465 5.52 3,579 151 4.22 2,323 56 2.41
HSBC Bank Canada ......... 3,167 138 4.36 2,115 62 2.93 2,163 45 2.08
Latin America HSBC Mexico .................. 3,395 227 6.69 2,994 228 7.62 3,771 227 6.02
Brazilian operations1 ........ 4,129 572 13.85 3,305 565 17.10 1,954 237 12.13
HSBC Bank Argentina ..... 196 8 4.08 264 7 2.65 250 3 1.20
Other operations .............................................. 16,816 627 3.73 15,023 456 3.04 19,515 329 1.69
164,455 7,396 4.50 131,251 4,600 3.50 131,447 3,637 2.77
Trading assets2
Europe HSBC Bank ...................... 29,183 1,147 3.93
HSBC France ................... 13,663 365 2.67
Hong Kong Hang Seng Bank ............... 369 13 3.52
The Hongkong and
Shanghai Banking
Corporation ..................
11,209 298 2.66
Rest of
Asia-Pacific
The Hongkong and
Shanghai Banking
Corporation ..................
2,487 101 4.06
HSBC Bank Malaysia ...... 145 4 2.76
North America HSBC Bank USA ............ . 5,447 115 2.11
HSBC Bank Canada ......... 1,177 25 2.12
HSBC Markets Inc ........... 11,543 421 3.65
Latin America HSBC Mexico .................. 2,957 173 5.86
Brazilian operations1 ........ 843 128 15.18
HSBC Bank Argentina ..... 19 1 5.26
Other operations .............................................. 5,661 232 4.10
84,703 3,023 3.57
For footnotes, see page 156.