HSBC 2006 Annual Report Download - page 347
Download and view the complete annual report
Please find page 347 of the 2006 HSBC annual report below. You can navigate through the pages in the report by either clicking on the pages listed below, or by using the keyword search tool below to find specific information within the annual report.-
 1
1 -
2
-
3
-
4
-
5
-
6
-
7
-
8
-
9
-
10
-
11
-
12
-
13
-
14
-
15
-
16
-
17
-
18
-
19
-
20
-
21
-
22
-
23
-
24
-
25
-
26
-
27
-
28
-
29
-
30
-
31
-
32
-
33
-
34
-
35
-
36
-
37
-
38
-
39
-
40
-
41
-
42
-
43
-
44
-
45
-
46
-
47
-
48
-
49
-
50
-
51
-
52
-
53
-
54
-
55
-
56
-
57
-
58
-
59
-
60
-
61
-
62
-
63
-
64
-
65
-
66
-
67
-
68
-
69
-
70
-
71
-
72
-
73
-
74
-
75
-
76
-
77
-
78
-
79
-
80
-
81
-
82
-
83
-
84
-
85
-
86
-
87
-
88
-
89
-
90
-
91
-
92
-
93
-
94
-
95
-
96
-
97
-
98
-
99
-
100
-
101
-
102
-
103
-
104
-
105
-
106
-
107
-
108
-
109
-
110
-
111
-
112
-
113
-
114
-
115
-
116
-
117
-
118
-
119
-
120
-
121
-
122
-
123
-
124
-
125
-
126
-
127
-
128
-
129
-
130
-
131
-
132
-
133
-
134
-
135
-
136
-
137
-
138
-
139
-
140
-
141
-
142
-
143
-
144
-
145
-
146
-
147
-
148
-
149
-
150
-
151
-
152
-
153
-
154
-
155
-
156
-
157
-
158
-
159
-
160
-
161
-
162
-
163
-
164
-
165
-
166
-
167
-
168
-
169
-
170
-
171
-
172
-
173
-
174
-
175
-
176
-
177
-
178
-
179
-
180
-
181
-
182
-
183
-
184
-
185
-
186
-
187
-
188
-
189
-
190
-
191
-
192
-
193
-
194
-
195
-
196
-
197
-
198
-
199
-
200
-
201
-
202
-
203
-
204
-
205
-
206
-
207
-
208
-
209
-
210
-
211
-
212
-
213
-
214
-
215
-
216
-
217
-
218
-
219
-
220
-
221
-
222
-
223
-
224
-
225
-
226
-
227
-
228
-
229
-
230
-
231
-
232
-
233
-
234
-
235
-
236
-
237
-
238
-
239
-
240
-
241
-
242
-
243
-
244
-
245
-
246
-
247
-
248
-
249
-
250
-
251
-
252
-
253
-
254
-
255
-
256
-
257
-
258
-
259
-
260
-
261
-
262
-
263
-
264
-
265
-
266
-
267
-
268
-
269
-
270
-
271
-
272
-
273
-
274
-
275
-
276
-
277
-
278
-
279
-
280
-
281
-
282
-
283
-
284
-
285
-
286
-
287
-
288
-
289
-
290
-
291
-
292
-
293
-
294
-
295
-
296
-
297
-
298
-
299
-
300
-
301
-
302
-
303
-
304
-
305
-
306
-
307
-
308
-
309
-
310
-
311
-
312
-
313
-
314
-
315
-
316
-
317
-
318
-
319
-
320
-
321
-
322
-
323
-
324
-
325
-
326
-
327
-
328
-
329
-
330
-
331
-
332
-
333
-
334
-
335
-
336
-
 337
337 -
 338
338 -
 339
339 -
 340
340 -
 341
341 -
 342
342 -
 343
343 -
 344
344 -
 345
345 -
 346
346 -
 347
347 -
 348
348 -
 349
349 -
 350
350 -
 351
351 -
 352
352 -
 353
353 -
 354
354 -
 355
355 -
 356
356 -
 357
357 -
358
-
359
-
360
-
361
-
362
-
363
-
364
-
365
-
366
-
367
-
368
-
369
-
370
-
371
-
372
-
373
-
374
-
375
-
376
-
377
-
378
-
379
-
380
-
381
-
382
-
383
-
384
-
385
-
386
-
387
-
388
-
389
-
390
-
391
-
392
-
393
-
394
-
395
-
396
-
397
-
398
-
399
-
400
-
401
-
402
-
403
-
404
-
405
-
406
-
407
-
408
-
409
-
410
-
411
-
412
-
413
-
414
-
415
-
416
-
417
-
418
-
419
-
420
-
421
-
422
-
423
-
424
-
425
-
426
-
427
-
428
-
429
-
430
-
431
-
432
-
433
-
434
-
435
-
436
-
437
-
438
-
439
-
440
-
441
-
442
-
443
-
444
-
445
-
446
-
447
-
448
-
449
-
450
-
451
-
452
-
453
-
454
-
455
-
456
-
457
-
458
 |
 |

345
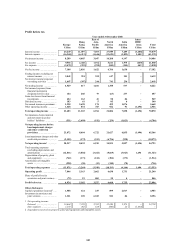
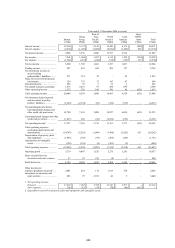
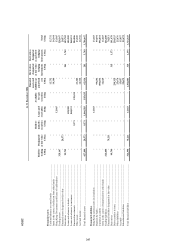
Year ended 31 December 2005
Personal
Financial
Services
Commercial
Banking
Corporate,
Investment
Banking
& Markets
Private
Banking Other
Intra-
HSBC
items
Total
US$m US$m US$m US$m US$m US$m US$m
Net interest income/(expense) .... 23,351 6,310 3,001 848 (472) (1,704) 31,334
Net fee income ............................ 7,313 2,876 2,967 1,080 220 – 14,456
Trading income/(expense)
excluding net interest income . 360 150 2,919 317 (90) – 3,656
Net interest income/(expense)
on trading activities ................ 214 (3) 306 – (13) 1,704 2,208
Net trading income/(expense) ..... 574 147 3,225 317 (103) 1,704 5,864
Net income/(expense) from
financial instruments
designated at fair value ........... 574 (12) 67 (1) 406 – 1,034
Gains less losses from financial
investments ............................. 19 9 475 45 144 – 692
Dividend income ......................... 16 9 79 9 42 – 155
Net earned insurance premiums .. 4,864 236 76 – 260 – 5,436
Other operating income .............. 729 327 1,621 68 2,634 (2,646) 2,733
Total operating income ............... 37,440 9,902 11,511 2,366 3,131 (2,646) 61,704
Net insurance claims incurred
and movement in policy-
holders’ liabilities ................... (3,716) (118) (54) – (179) – (4,067)
Net operating income1 ................ 33,724 9,784 11,457 2,366 2,952 (2,646) 57,637
Loan impairment (charges)/
recoveries and other credit
risk provisions ........................ (7,537) (547) 272 12 (1) – (7,801)
Net operating income2 ................ 26,187 9,237 11,729 2,378 2,951 (2,646) 49,836
Operating expenses ..................... (16,427) (4,453) (6,838) (1,466) (2,976) 2,646 (29,514)
Operating profit/(loss) ................ 9,760 4,784 4,891 912 (25) – 20,322
Share of profit in associates
and joint ventures ................... 144 177 272 – 51 – 644
Profit before tax .......................... 9,904 4,961 5,163 912 26 – 20,966
Capital expenditure incurred3 ..... 1,583 411 1,783 102 594 – 4,473
1 Net operating income before loan impairment (charges)/recoveries and other credit risk provisions.
2 Net operating income:
External .................................. 25,000 8,258 13,998 1,668 912 – 49,836
Inter-segment .......................... 1,187 979 (2,269) 710 2,039 (2,646) –
3 Expenditure incurred on property, plant and equipment and intangible assets.