HSBC 2006 Annual Report Download - page 360
Download and view the complete annual report
Please find page 360 of the 2006 HSBC annual report below. You can navigate through the pages in the report by either clicking on the pages listed below, or by using the keyword search tool below to find specific information within the annual report.-
 1
1 -
2
-
3
-
4
-
5
-
6
-
7
-
8
-
9
-
10
-
11
-
12
-
13
-
14
-
15
-
16
-
17
-
18
-
19
-
20
-
21
-
22
-
23
-
24
-
25
-
26
-
27
-
28
-
29
-
30
-
31
-
32
-
33
-
34
-
35
-
36
-
37
-
38
-
39
-
40
-
41
-
42
-
43
-
44
-
45
-
46
-
47
-
48
-
49
-
50
-
51
-
52
-
53
-
54
-
55
-
56
-
57
-
58
-
59
-
60
-
61
-
62
-
63
-
64
-
65
-
66
-
67
-
68
-
69
-
70
-
71
-
72
-
73
-
74
-
75
-
76
-
77
-
78
-
79
-
80
-
81
-
82
-
83
-
84
-
85
-
86
-
87
-
88
-
89
-
90
-
91
-
92
-
93
-
94
-
95
-
96
-
97
-
98
-
99
-
100
-
101
-
102
-
103
-
104
-
105
-
106
-
107
-
108
-
109
-
110
-
111
-
112
-
113
-
114
-
115
-
116
-
117
-
118
-
119
-
120
-
121
-
122
-
123
-
124
-
125
-
126
-
127
-
128
-
129
-
130
-
131
-
132
-
133
-
134
-
135
-
136
-
137
-
138
-
139
-
140
-
141
-
142
-
143
-
144
-
145
-
146
-
147
-
148
-
149
-
150
-
151
-
152
-
153
-
154
-
155
-
156
-
157
-
158
-
159
-
160
-
161
-
162
-
163
-
164
-
165
-
166
-
167
-
168
-
169
-
170
-
171
-
172
-
173
-
174
-
175
-
176
-
177
-
178
-
179
-
180
-
181
-
182
-
183
-
184
-
185
-
186
-
187
-
188
-
189
-
190
-
191
-
192
-
193
-
194
-
195
-
196
-
197
-
198
-
199
-
200
-
201
-
202
-
203
-
204
-
205
-
206
-
207
-
208
-
209
-
210
-
211
-
212
-
213
-
214
-
215
-
216
-
217
-
218
-
219
-
220
-
221
-
222
-
223
-
224
-
225
-
226
-
227
-
228
-
229
-
230
-
231
-
232
-
233
-
234
-
235
-
236
-
237
-
238
-
239
-
240
-
241
-
242
-
243
-
244
-
245
-
246
-
247
-
248
-
249
-
250
-
251
-
252
-
253
-
254
-
255
-
256
-
257
-
258
-
259
-
260
-
261
-
262
-
263
-
264
-
265
-
266
-
267
-
268
-
269
-
270
-
271
-
272
-
273
-
274
-
275
-
276
-
277
-
278
-
279
-
280
-
281
-
282
-
283
-
284
-
285
-
286
-
287
-
288
-
289
-
290
-
291
-
292
-
293
-
294
-
295
-
296
-
297
-
298
-
299
-
300
-
301
-
302
-
303
-
304
-
305
-
306
-
307
-
308
-
309
-
310
-
311
-
312
-
313
-
314
-
315
-
316
-
317
-
318
-
319
-
320
-
321
-
322
-
323
-
324
-
325
-
326
-
327
-
328
-
329
-
330
-
331
-
332
-
333
-
334
-
335
-
336
-
337
-
338
-
339
-
340
-
341
-
342
-
343
-
344
-
345
-
346
-
347
-
348
-
349
-
 350
350 -
 351
351 -
 352
352 -
 353
353 -
 354
354 -
 355
355 -
 356
356 -
 357
357 -
 358
358 -
 359
359 -
 360
360 -
 361
361 -
 362
362 -
 363
363 -
 364
364 -
 365
365 -
 366
366 -
 367
367 -
 368
368 -
 369
369 -
 370
370 -
371
-
372
-
373
-
374
-
375
-
376
-
377
-
378
-
379
-
380
-
381
-
382
-
383
-
384
-
385
-
386
-
387
-
388
-
389
-
390
-
391
-
392
-
393
-
394
-
395
-
396
-
397
-
398
-
399
-
400
-
401
-
402
-
403
-
404
-
405
-
406
-
407
-
408
-
409
-
410
-
411
-
412
-
413
-
414
-
415
-
416
-
417
-
418
-
419
-
420
-
421
-
422
-
423
-
424
-
425
-
426
-
427
-
428
-
429
-
430
-
431
-
432
-
433
-
434
-
435
-
436
-
437
-
438
-
439
-
440
-
441
-
442
-
443
-
444
-
445
-
446
-
447
-
448
-
449
-
450
-
451
-
452
-
453
-
454
-
455
-
456
-
457
-
458
 |
 |

HSBC HOLDINGS PLC
Notes on the Financial Statements (continued)
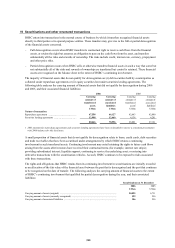
Notes 18 and 19
358
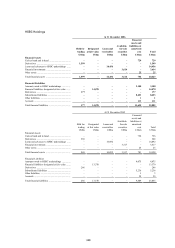
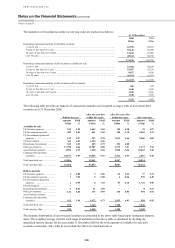
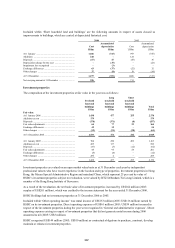
The maturities of investment securities at carrying value are analysed as follows:
At 31 December
2006 2005
US$m US$m
Remaining contractual maturity of total debt securities:
1 year or less .................................................................................................................................. 63,932 50,991
5 years or less but over 1 year ....................................................................................................... 55,145 56,956
10 years or less but over 5 years ................................................................................................... 12,015 10,902
over 10 years ................................................................................................................................. 40,104 30,932
171,196 149,781
Remaining contractual maturity of debt securities available for sale:
1 year or less .................................................................................................................................. 63,382 50,559
5 years or less but over 1 year ....................................................................................................... 53,497 55,531
10 years or less but over 5 years ................................................................................................... 8,827 8,636
over 10 years ................................................................................................................................. 36,164 26,973
161,870 141,699
Remaining contractual maturity of debt securities held to maturity:
1 year or less .................................................................................................................................. 550 432
5 years or less but over 1 year ....................................................................................................... 1,648 1,425
10 years or less but over 5 years ................................................................................................... 3,188 2,266
over 10 years ................................................................................................................................. 3,940 3,959
9,326 8,082
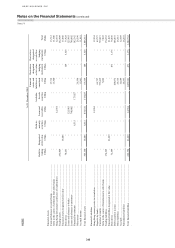
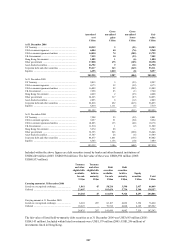
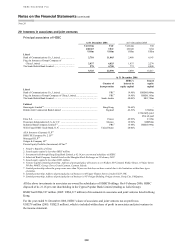
The following table provides an analysis of contractual maturities and weighted average yields of investment debt
securities as at 31 December 2006:
Within one year
After one year but
within five years
After five years but
within ten years After ten years
Amount Yield Amount Yield Amount Yield Amount Yield
US$m % US$m % US$m % US$m %
Available-for-sale
US Treasury agencies .................... 199 3.95 1,463 3.65 125 4.38 22 4.97
US Government agencies .............. 409 4.81 461 5.30 100 5.10 4,449 5.13
US Government-sponsored
agencies ..................................... 145 2.97
927 2.78
1,533 2.66
9,560 4.85
UK Government ............................. 769 3.87 1,324 5.26 – – – –
Hong Kong Government ............... 265 2.22 205 2.75 194 4.88
– –
Other governments ........................ 11,790 4.06 11,907 8.00 2,175 7.07 1,274 7.54
Asset-backed securities ................. 4,554 4.79 1,228 5.65 1,928 5.24 19,042 5.45
Corporate debt and other
securities .................................... 44,875 3.93
36,046 5.41
2,512 4.53
2,487 5.18
Total amortised cost ....................... 63,006 53,561 8,567 36,834
Total carrying value ....................... 63,382 53,497 8,827 36,164
Held-to-maturity
US Treasury agencies .................... 3 5.88 3 5.06 26 4.23 77 5.11
US Government agencies .............. 1 7.05 9 6.98 4 8.66 570 6.49
US Government-sponsored
agencies ..................................... 2 6.99
8 7.35
93 6.10
1,741 5.90
UK Government ............................. – – – –
– – – –
Hong Kong Government ............... 6 8.01 21 3.95 – – 8 5.21
Other governments ........................ 126 4.20 135 5.95 130 4.84 594 4.94
Asset-backed securities ................. – – – – – – – –
Corporate debt and other
securities .................................... 412 3.96
1,472 4.73
2,935 4.83
950 4.92
Total amortised cost ....................... 550 1,648 3,188 3,940
Total carrying value ....................... 550 1,648 3,188 3,940
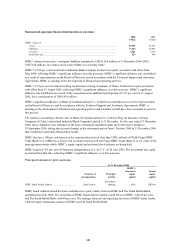
The maturity distributions of asset-backed securities are presented in the above table based upon contractual maturity
dates. The weighted average yield for each range of maturities in the above table is calculated by dividing the
annualised interest income for the year ended 31 December 2006 by the book amount of available-for-sale debt
securities at that date. The yields do not include the effect of related derivatives.