HSBC 2006 Annual Report Download - page 359
Download and view the complete annual report
Please find page 359 of the 2006 HSBC annual report below. You can navigate through the pages in the report by either clicking on the pages listed below, or by using the keyword search tool below to find specific information within the annual report.-
 1
1 -
2
-
3
-
4
-
5
-
6
-
7
-
8
-
9
-
10
-
11
-
12
-
13
-
14
-
15
-
16
-
17
-
18
-
19
-
20
-
21
-
22
-
23
-
24
-
25
-
26
-
27
-
28
-
29
-
30
-
31
-
32
-
33
-
34
-
35
-
36
-
37
-
38
-
39
-
40
-
41
-
42
-
43
-
44
-
45
-
46
-
47
-
48
-
49
-
50
-
51
-
52
-
53
-
54
-
55
-
56
-
57
-
58
-
59
-
60
-
61
-
62
-
63
-
64
-
65
-
66
-
67
-
68
-
69
-
70
-
71
-
72
-
73
-
74
-
75
-
76
-
77
-
78
-
79
-
80
-
81
-
82
-
83
-
84
-
85
-
86
-
87
-
88
-
89
-
90
-
91
-
92
-
93
-
94
-
95
-
96
-
97
-
98
-
99
-
100
-
101
-
102
-
103
-
104
-
105
-
106
-
107
-
108
-
109
-
110
-
111
-
112
-
113
-
114
-
115
-
116
-
117
-
118
-
119
-
120
-
121
-
122
-
123
-
124
-
125
-
126
-
127
-
128
-
129
-
130
-
131
-
132
-
133
-
134
-
135
-
136
-
137
-
138
-
139
-
140
-
141
-
142
-
143
-
144
-
145
-
146
-
147
-
148
-
149
-
150
-
151
-
152
-
153
-
154
-
155
-
156
-
157
-
158
-
159
-
160
-
161
-
162
-
163
-
164
-
165
-
166
-
167
-
168
-
169
-
170
-
171
-
172
-
173
-
174
-
175
-
176
-
177
-
178
-
179
-
180
-
181
-
182
-
183
-
184
-
185
-
186
-
187
-
188
-
189
-
190
-
191
-
192
-
193
-
194
-
195
-
196
-
197
-
198
-
199
-
200
-
201
-
202
-
203
-
204
-
205
-
206
-
207
-
208
-
209
-
210
-
211
-
212
-
213
-
214
-
215
-
216
-
217
-
218
-
219
-
220
-
221
-
222
-
223
-
224
-
225
-
226
-
227
-
228
-
229
-
230
-
231
-
232
-
233
-
234
-
235
-
236
-
237
-
238
-
239
-
240
-
241
-
242
-
243
-
244
-
245
-
246
-
247
-
248
-
249
-
250
-
251
-
252
-
253
-
254
-
255
-
256
-
257
-
258
-
259
-
260
-
261
-
262
-
263
-
264
-
265
-
266
-
267
-
268
-
269
-
270
-
271
-
272
-
273
-
274
-
275
-
276
-
277
-
278
-
279
-
280
-
281
-
282
-
283
-
284
-
285
-
286
-
287
-
288
-
289
-
290
-
291
-
292
-
293
-
294
-
295
-
296
-
297
-
298
-
299
-
300
-
301
-
302
-
303
-
304
-
305
-
306
-
307
-
308
-
309
-
310
-
311
-
312
-
313
-
314
-
315
-
316
-
317
-
318
-
319
-
320
-
321
-
322
-
323
-
324
-
325
-
326
-
327
-
328
-
329
-
330
-
331
-
332
-
333
-
334
-
335
-
336
-
337
-
338
-
339
-
340
-
341
-
342
-
343
-
344
-
345
-
346
-
347
-
348
-
 349
349 -
 350
350 -
 351
351 -
 352
352 -
 353
353 -
 354
354 -
 355
355 -
 356
356 -
 357
357 -
 358
358 -
 359
359 -
 360
360 -
 361
361 -
 362
362 -
 363
363 -
 364
364 -
 365
365 -
 366
366 -
 367
367 -
 368
368 -
 369
369 -
370
-
371
-
372
-
373
-
374
-
375
-
376
-
377
-
378
-
379
-
380
-
381
-
382
-
383
-
384
-
385
-
386
-
387
-
388
-
389
-
390
-
391
-
392
-
393
-
394
-
395
-
396
-
397
-
398
-
399
-
400
-
401
-
402
-
403
-
404
-
405
-
406
-
407
-
408
-
409
-
410
-
411
-
412
-
413
-
414
-
415
-
416
-
417
-
418
-
419
-
420
-
421
-
422
-
423
-
424
-
425
-
426
-
427
-
428
-
429
-
430
-
431
-
432
-
433
-
434
-
435
-
436
-
437
-
438
-
439
-
440
-
441
-
442
-
443
-
444
-
445
-
446
-
447
-
448
-
449
-
450
-
451
-
452
-
453
-
454
-
455
-
456
-
457
-
458
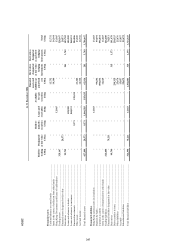
 |
 |

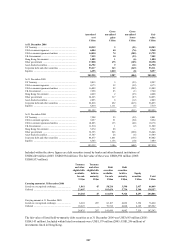
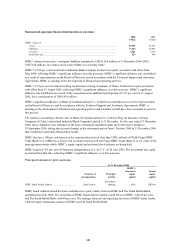
357
Amortised
cost
Gross
unrealised
gains
Gross
unrealised
losses
Fair
value
US$m US$m US$m US$m
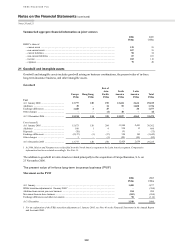
At 31 December 2006
US Treasury ................................................................... 10,219 5 (21) 10,203
US Government agencies .............................................. 6,004 40 (76) 5,968
US Government sponsored entities .............................. 14,010 74 (285) 13,799
UK Government ............................................................ 7,515 10 (23) 7,502
Hong Kong Government .............................................. 1,085 1 (6) 1,080
Other government ......................................................... 37,828 475 (105) 38,198
Asset-backed securities ................................................. 26,752 9 (11) 26,750
Corporate debt and other securities .............................. 93,217 363 (269) 93,311
Equities ......................................................................... 6,295 2,010 (8) 8,297
202,925 2,987 (804) 205,108
At 31 December 2005
US Treasury ................................................................... 9,015 5 (23) 8,997
US Government agencies .............................................. 4,173 52 (52) 4,173
US Government sponsored entities .............................. 16,099 82 (292) 15,889
UK Government ............................................................ 7,658 83 (1) 7,740
Hong Kong Government .............................................. 4,429 2 (23) 4,408
Other government ......................................................... 34,623 317 (87) 34,853
Asset-backed securities ................................................. 2,893 8 (12) 2,889
Corporate debt and other securities .............................. 96,018 452 (415) 96,055
Equities ......................................................................... 6,414 1,111 (6) 7,519
181,322 2,112 (911) 182,523
At 31 December 2004
US Treasury ................................................................... 7,998 25 (22) 8,001
US Government agencies .............................................. 9,657 91 (94) 9,654
US Government sponsored entities .............................. 10,093 133 (48) 10,178
UK Government ............................................................ 11,510 1 (2) 11,509
Hong Kong Government .............................................. 5,274 88 – 5,362
Other government ......................................................... 36,393 543 (290) 36,646
Asset-backed securities ................................................. 13,367 28 (6) 13,389
Corporate debt and other securities .............................. 84,477 1,061 (136) 85,402
Equities ......................................................................... 6,563 1,136 (10) 7,689
185,332 3,106 (608) 187,830
Included within the above figures are debt securities issued by banks and other financial institutions of
US$86,649 million (2005: US$68,954 million). The fair value of these was US$86,596 million (2005:
US$68,933 million).
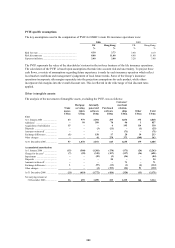
Treasury
and other
eligible bills
available-
for-sale
Treasury
and other
eligible bills
held-to-
maturity
Debt
securities
available-
for-sale
Debt
securities
held-to-
maturity
Equity
securities
Total
US$m US$m US$m US$m US$m US$m
Carrying amount at 31 December 2006
Listed on a recognised exchange ........................ 1,861 45 58,216 3,590 2,937 66,649
Unlisted ............................................................... 23,407 – 103,654 5,736 5,360 138,157
25,268 45 161,870 9,326 8,297 204,806
Carrying amount at 31 December 2005
Listed on a recognised exchange ........................ 6,610 207 62,187 4,022 3,394 76,420
Unlisted ............................................................... 18,225 – 79,512 4,060 4,125 105,922
24,835 207 141,699 8,082 7,519 182,342
The fair value of listed held-to-maturity debt securities as at 31 December 2006 was US$3,663 million (2005:
US$4,143 million). Included within listed investments were US$1,179 million (2005: US$1,246 million) of
investments listed in Hong Kong.