HSBC 2006 Annual Report Download - page 244
Download and view the complete annual report
Please find page 244 of the 2006 HSBC annual report below. You can navigate through the pages in the report by either clicking on the pages listed below, or by using the keyword search tool below to find specific information within the annual report.-
 1
1 -
2
-
3
-
4
-
5
-
6
-
7
-
8
-
9
-
10
-
11
-
12
-
13
-
14
-
15
-
16
-
17
-
18
-
19
-
20
-
21
-
22
-
23
-
24
-
25
-
26
-
27
-
28
-
29
-
30
-
31
-
32
-
33
-
34
-
35
-
36
-
37
-
38
-
39
-
40
-
41
-
42
-
43
-
44
-
45
-
46
-
47
-
48
-
49
-
50
-
51
-
52
-
53
-
54
-
55
-
56
-
57
-
58
-
59
-
60
-
61
-
62
-
63
-
64
-
65
-
66
-
67
-
68
-
69
-
70
-
71
-
72
-
73
-
74
-
75
-
76
-
77
-
78
-
79
-
80
-
81
-
82
-
83
-
84
-
85
-
86
-
87
-
88
-
89
-
90
-
91
-
92
-
93
-
94
-
95
-
96
-
97
-
98
-
99
-
100
-
101
-
102
-
103
-
104
-
105
-
106
-
107
-
108
-
109
-
110
-
111
-
112
-
113
-
114
-
115
-
116
-
117
-
118
-
119
-
120
-
121
-
122
-
123
-
124
-
125
-
126
-
127
-
128
-
129
-
130
-
131
-
132
-
133
-
134
-
135
-
136
-
137
-
138
-
139
-
140
-
141
-
142
-
143
-
144
-
145
-
146
-
147
-
148
-
149
-
150
-
151
-
152
-
153
-
154
-
155
-
156
-
157
-
158
-
159
-
160
-
161
-
162
-
163
-
164
-
165
-
166
-
167
-
168
-
169
-
170
-
171
-
172
-
173
-
174
-
175
-
176
-
177
-
178
-
179
-
180
-
181
-
182
-
183
-
184
-
185
-
186
-
187
-
188
-
189
-
190
-
191
-
192
-
193
-
194
-
195
-
196
-
197
-
198
-
199
-
200
-
201
-
202
-
203
-
204
-
205
-
206
-
207
-
208
-
209
-
210
-
211
-
212
-
213
-
214
-
215
-
216
-
217
-
218
-
219
-
220
-
221
-
222
-
223
-
224
-
225
-
226
-
227
-
228
-
229
-
230
-
231
-
232
-
233
-
 234
234 -
 235
235 -
 236
236 -
 237
237 -
 238
238 -
 239
239 -
 240
240 -
 241
241 -
 242
242 -
 243
243 -
 244
244 -
 245
245 -
 246
246 -
 247
247 -
 248
248 -
 249
249 -
 250
250 -
 251
251 -
 252
252 -
 253
253 -
 254
254 -
255
-
256
-
257
-
258
-
259
-
260
-
261
-
262
-
263
-
264
-
265
-
266
-
267
-
268
-
269
-
270
-
271
-
272
-
273
-
274
-
275
-
276
-
277
-
278
-
279
-
280
-
281
-
282
-
283
-
284
-
285
-
286
-
287
-
288
-
289
-
290
-
291
-
292
-
293
-
294
-
295
-
296
-
297
-
298
-
299
-
300
-
301
-
302
-
303
-
304
-
305
-
306
-
307
-
308
-
309
-
310
-
311
-
312
-
313
-
314
-
315
-
316
-
317
-
318
-
319
-
320
-
321
-
322
-
323
-
324
-
325
-
326
-
327
-
328
-
329
-
330
-
331
-
332
-
333
-
334
-
335
-
336
-
337
-
338
-
339
-
340
-
341
-
342
-
343
-
344
-
345
-
346
-
347
-
348
-
349
-
350
-
351
-
352
-
353
-
354
-
355
-
356
-
357
-
358
-
359
-
360
-
361
-
362
-
363
-
364
-
365
-
366
-
367
-
368
-
369
-
370
-
371
-
372
-
373
-
374
-
375
-
376
-
377
-
378
-
379
-
380
-
381
-
382
-
383
-
384
-
385
-
386
-
387
-
388
-
389
-
390
-
391
-
392
-
393
-
394
-
395
-
396
-
397
-
398
-
399
-
400
-
401
-
402
-
403
-
404
-
405
-
406
-
407
-
408
-
409
-
410
-
411
-
412
-
413
-
414
-
415
-
416
-
417
-
418
-
419
-
420
-
421
-
422
-
423
-
424
-
425
-
426
-
427
-
428
-
429
-
430
-
431
-
432
-
433
-
434
-
435
-
436
-
437
-
438
-
439
-
440
-
441
-
442
-
443
-
444
-
445
-
446
-
447
-
448
-
449
-
450
-
451
-
452
-
453
-
454
-
455
-
456
-
457
-
458
 |
 |

HSBC HOLDINGS PLC
Report of the Directors: The Management of Risk (continued)
Insurance operations > PVIF / Capital management and allocation
242
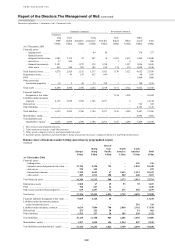
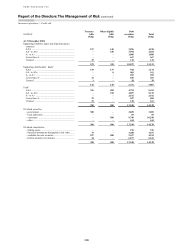
The following table shows the movements
recorded during the year in respect of PVIF and the
net assets of insurance operations:
Movements in PVIF and net assets of insurance operations
(Audited)
2006 2005
PVIF
Net assets
of insurance
operations Tot al PVIF
Net assets
of insurance
operations
Total
US$m US$m US$m US$m US$m US$m
At 1 January ........................................................ 1,400 3,582 4,982 1,493 2,695 4,188
Value of new business written during the year1 . 254 – 254 289 – 289
Movements arising from in-force business:
– expected return ............................................ (233) – (233) (181) – (181)
– experience variances2 .................................. 31 – 31 15 – 15
– change in operating assumptions ................ (17) – (17) (121) – (121)
Investment return variances ................................ 13 – 13 19 – 19
Changes in investment assumptions ................... 3 – 3 – – –
Return on net assets ............................................ – 752 752 – 1,062 1,062
Exchange differences and other ......................... 98 95 193 (114) (90) (204)
Capital transactions ............................................ – (29) (29) – (85) (85)
At 31 December .................................................. 1,549 4,400 5,949 1,400 3,582 4,982
1 Value of net new business during the year is the present value of the projected stream of profits from the business.
2 Experience variances include the effect of the difference between demographic, expense and persistency assumptions used in the
previous PVIF calculation and actual experience observed during the year.
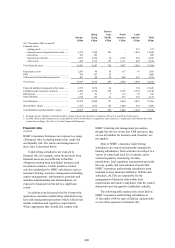
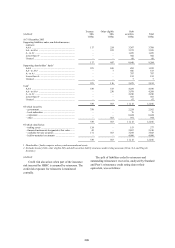
Non-economic assumptions
(Audited)
The sensitivity of profit for the year to, and net
assets at, 31 December 2006 to reasonably possible
changes in conditions at 31 December 2006 across
all insurance underwriting subsidiaries was as
follows:
2006 2005
Impact on
profit for
the year
Impact on
net assets
Impact on
profit for
the year
Impact on
net assets
US$m US$m US$m US$m
20% increase in claims costs ........................................ (118) (118) (82) (78)
20% decrease in claims costs ....................................... 118 118 81 78
10% increase in mortality and/or morbidity rates ........ (8) (8) (8) (9)
10% decrease in mortality and/or morbidity rates ....... 15 15 18 18
50% increase in lapse rates ........................................... 10 10 (17) (14)
50% decrease in lapse rates .......................................... 22 22 56 51
10% increase in expense rates ...................................... (23) (23) (20) (20)
10% decrease in expense rates ..................................... 23 23 19 19