HSBC 2006 Annual Report Download - page 134
Download and view the complete annual report
Please find page 134 of the 2006 HSBC annual report below. You can navigate through the pages in the report by either clicking on the pages listed below, or by using the keyword search tool below to find specific information within the annual report.-
 1
1 -
2
-
3
-
4
-
5
-
6
-
7
-
8
-
9
-
10
-
11
-
12
-
13
-
14
-
15
-
16
-
17
-
18
-
19
-
20
-
21
-
22
-
23
-
24
-
25
-
26
-
27
-
28
-
29
-
30
-
31
-
32
-
33
-
34
-
35
-
36
-
37
-
38
-
39
-
40
-
41
-
42
-
43
-
44
-
45
-
46
-
47
-
48
-
49
-
50
-
51
-
52
-
53
-
54
-
55
-
56
-
57
-
58
-
59
-
60
-
61
-
62
-
63
-
64
-
65
-
66
-
67
-
68
-
69
-
70
-
71
-
72
-
73
-
74
-
75
-
76
-
77
-
78
-
79
-
80
-
81
-
82
-
83
-
84
-
85
-
86
-
87
-
88
-
89
-
90
-
91
-
92
-
93
-
94
-
95
-
96
-
97
-
98
-
99
-
100
-
101
-
102
-
103
-
104
-
105
-
106
-
107
-
108
-
109
-
110
-
111
-
112
-
113
-
114
-
115
-
116
-
117
-
118
-
119
-
120
-
121
-
122
-
123
-
 124
124 -
 125
125 -
 126
126 -
 127
127 -
 128
128 -
 129
129 -
 130
130 -
 131
131 -
 132
132 -
 133
133 -
 134
134 -
 135
135 -
 136
136 -
 137
137 -
 138
138 -
 139
139 -
 140
140 -
 141
141 -
 142
142 -
 143
143 -
 144
144 -
145
-
146
-
147
-
148
-
149
-
150
-
151
-
152
-
153
-
154
-
155
-
156
-
157
-
158
-
159
-
160
-
161
-
162
-
163
-
164
-
165
-
166
-
167
-
168
-
169
-
170
-
171
-
172
-
173
-
174
-
175
-
176
-
177
-
178
-
179
-
180
-
181
-
182
-
183
-
184
-
185
-
186
-
187
-
188
-
189
-
190
-
191
-
192
-
193
-
194
-
195
-
196
-
197
-
198
-
199
-
200
-
201
-
202
-
203
-
204
-
205
-
206
-
207
-
208
-
209
-
210
-
211
-
212
-
213
-
214
-
215
-
216
-
217
-
218
-
219
-
220
-
221
-
222
-
223
-
224
-
225
-
226
-
227
-
228
-
229
-
230
-
231
-
232
-
233
-
234
-
235
-
236
-
237
-
238
-
239
-
240
-
241
-
242
-
243
-
244
-
245
-
246
-
247
-
248
-
249
-
250
-
251
-
252
-
253
-
254
-
255
-
256
-
257
-
258
-
259
-
260
-
261
-
262
-
263
-
264
-
265
-
266
-
267
-
268
-
269
-
270
-
271
-
272
-
273
-
274
-
275
-
276
-
277
-
278
-
279
-
280
-
281
-
282
-
283
-
284
-
285
-
286
-
287
-
288
-
289
-
290
-
291
-
292
-
293
-
294
-
295
-
296
-
297
-
298
-
299
-
300
-
301
-
302
-
303
-
304
-
305
-
306
-
307
-
308
-
309
-
310
-
311
-
312
-
313
-
314
-
315
-
316
-
317
-
318
-
319
-
320
-
321
-
322
-
323
-
324
-
325
-
326
-
327
-
328
-
329
-
330
-
331
-
332
-
333
-
334
-
335
-
336
-
337
-
338
-
339
-
340
-
341
-
342
-
343
-
344
-
345
-
346
-
347
-
348
-
349
-
350
-
351
-
352
-
353
-
354
-
355
-
356
-
357
-
358
-
359
-
360
-
361
-
362
-
363
-
364
-
365
-
366
-
367
-
368
-
369
-
370
-
371
-
372
-
373
-
374
-
375
-
376
-
377
-
378
-
379
-
380
-
381
-
382
-
383
-
384
-
385
-
386
-
387
-
388
-
389
-
390
-
391
-
392
-
393
-
394
-
395
-
396
-
397
-
398
-
399
-
400
-
401
-
402
-
403
-
404
-
405
-
406
-
407
-
408
-
409
-
410
-
411
-
412
-
413
-
414
-
415
-
416
-
417
-
418
-
419
-
420
-
421
-
422
-
423
-
424
-
425
-
426
-
427
-
428
-
429
-
430
-
431
-
432
-
433
-
434
-
435
-
436
-
437
-
438
-
439
-
440
-
441
-
442
-
443
-
444
-
445
-
446
-
447
-
448
-
449
-
450
-
451
-
452
-
453
-
454
-
455
-
456
-
457
-
458
 |
 |

HSBC HOLDINGS PLC
Report of the Directors: Financial Review (continued)
Net earned insurance premiums / Other operating income
132
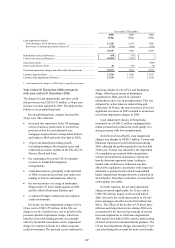
• the partial sale by Private Banking of a holding
in the Hermitage Fund contributed a gain of
US$117 million for the year; and
• the sale of a portfolio of structured finance
investments, classified as debt securities,
contributed a gain of US$112 million.
Year ended 31 December 2005 compared
with year ended 31 December 2004
The net gain of US$692 million from the disposal of
available-for-sale financial investments was
28 per cent higher than in 2004. Lower income from
the disposal of debt securities was more than
compensated for by an increase in gains from the
disposal of private equity investments, particularly in
HSBC’s European operations.
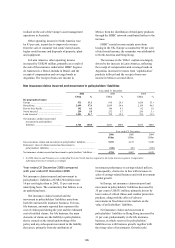
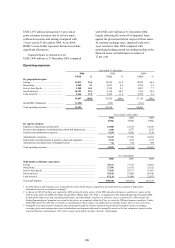
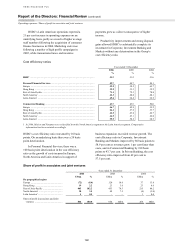
Net earned insurance premiums
Year ended 31 December
2006 2005 2004
US$m % US$m % US$m %
By geographical region
Europe ...................................................... 1,298 22.9 1,599 29.4 1,875 34.9
Hong Kong .............................................. 2,628 46.3 2,334 42.9 2,247 41.9
Rest of Asia-Pacific ................................. 174 3.1 155 2.9 97 1.8
North America1 ........................................ 492 8.7 477 8.8 450 8.4
Latin America1 ......................................... 1,076 19.0 871 16.0 699 13.0
Net earned insurance premiums .............. 5,668 100.0 5,436 100.0 5,368 100.0
Year ended 31 December
2006
US$m
2005
US$m
2004
US$m
Gross insurance premium income ................................................................... 6,455 6,152 6,022
Reinsurance premiums .................................................................................... (787) (716) (654)
Net earned insurance premiums ...................................................................... 5,668 5,436 5,368
1 In 2006, Mexico and Panama were reclassified from the North America segment to Latin America. Comparative information has been
restated accordingly.
Year ended 31 December 2006 compared
with year ended 31 December 2005
Net earned insurance premiums of US$5,668 million
were 4 per cent higher than in 2005, 3 per cent on an
underlying basis. The commentary that follows is on
an underlying basis.
In Europe, net earned premium income
decreased by 19 per cent to US$1,298 million. This
was largely in the UK, where lower sales of single
premium insurance contracts, a lower market
appreciation of investment assets and the effect of
changes in reinsurance arrangements were the
principal drivers of the decrease.
In Hong Kong, net earned premium income
increased by 13 per cent, driven by the life insurance
business. New products, many designed to meet
financial needs identified in HSBC’s global study on
the future of retirement, were supported by increased
promotional and marketing activity, and the
development of internet and telephone distribution
channels. Sales rose in consequence.
In the Rest of Asia-Pacific net earned
premium income rose by 5 per cent growth to
US$174 million. This was concentrated in Singapore
and reflected the success of new product launches,
supported by increased marketing. Increased sales of
individual life policies were the main driver of the
growth. HSBC continued to expand its insurance
business across the Rest of Asia-Pacific with a
number of initiatives including the establishment of
HSBC’s first Islamic insurance company in
Malaysia.
In North America, the modest rise in net
premium income to US$492 million reflected growth
from new life business underwritten in 2006, which
was substantially offset by a decline in the non-life
business.
Improved cross-selling drove growth across
Latin America, and income rose by 18 per cent to
US$1,076 million. In Mexico, growth in individual
life, casualty and motor insurance was partly offset
by increased reinsurance costs. In Brazil, growth was
led by strong sales of both life and pension products.
In Argentina, increased advertising partnerships with
established local consumer brands and internal cross-
selling initiatives led to a rise in motor, home and
extended-warranty insurance premium income. This