HSBC 2006 Annual Report Download - page 156
Download and view the complete annual report
Please find page 156 of the 2006 HSBC annual report below. You can navigate through the pages in the report by either clicking on the pages listed below, or by using the keyword search tool below to find specific information within the annual report.-
 1
1 -
2
-
3
-
4
-
5
-
6
-
7
-
8
-
9
-
10
-
11
-
12
-
13
-
14
-
15
-
16
-
17
-
18
-
19
-
20
-
21
-
22
-
23
-
24
-
25
-
26
-
27
-
28
-
29
-
30
-
31
-
32
-
33
-
34
-
35
-
36
-
37
-
38
-
39
-
40
-
41
-
42
-
43
-
44
-
45
-
46
-
47
-
48
-
49
-
50
-
51
-
52
-
53
-
54
-
55
-
56
-
57
-
58
-
59
-
60
-
61
-
62
-
63
-
64
-
65
-
66
-
67
-
68
-
69
-
70
-
71
-
72
-
73
-
74
-
75
-
76
-
77
-
78
-
79
-
80
-
81
-
82
-
83
-
84
-
85
-
86
-
87
-
88
-
89
-
90
-
91
-
92
-
93
-
94
-
95
-
96
-
97
-
98
-
99
-
100
-
101
-
102
-
103
-
104
-
105
-
106
-
107
-
108
-
109
-
110
-
111
-
112
-
113
-
114
-
115
-
116
-
117
-
118
-
119
-
120
-
121
-
122
-
123
-
124
-
125
-
126
-
127
-
128
-
129
-
130
-
131
-
132
-
133
-
134
-
135
-
136
-
137
-
138
-
139
-
140
-
141
-
142
-
143
-
144
-
145
-
 146
146 -
 147
147 -
 148
148 -
 149
149 -
 150
150 -
 151
151 -
 152
152 -
 153
153 -
 154
154 -
 155
155 -
 156
156 -
 157
157 -
 158
158 -
 159
159 -
 160
160 -
 161
161 -
 162
162 -
 163
163 -
 164
164 -
 165
165 -
 166
166 -
167
-
168
-
169
-
170
-
171
-
172
-
173
-
174
-
175
-
176
-
177
-
178
-
179
-
180
-
181
-
182
-
183
-
184
-
185
-
186
-
187
-
188
-
189
-
190
-
191
-
192
-
193
-
194
-
195
-
196
-
197
-
198
-
199
-
200
-
201
-
202
-
203
-
204
-
205
-
206
-
207
-
208
-
209
-
210
-
211
-
212
-
213
-
214
-
215
-
216
-
217
-
218
-
219
-
220
-
221
-
222
-
223
-
224
-
225
-
226
-
227
-
228
-
229
-
230
-
231
-
232
-
233
-
234
-
235
-
236
-
237
-
238
-
239
-
240
-
241
-
242
-
243
-
244
-
245
-
246
-
247
-
248
-
249
-
250
-
251
-
252
-
253
-
254
-
255
-
256
-
257
-
258
-
259
-
260
-
261
-
262
-
263
-
264
-
265
-
266
-
267
-
268
-
269
-
270
-
271
-
272
-
273
-
274
-
275
-
276
-
277
-
278
-
279
-
280
-
281
-
282
-
283
-
284
-
285
-
286
-
287
-
288
-
289
-
290
-
291
-
292
-
293
-
294
-
295
-
296
-
297
-
298
-
299
-
300
-
301
-
302
-
303
-
304
-
305
-
306
-
307
-
308
-
309
-
310
-
311
-
312
-
313
-
314
-
315
-
316
-
317
-
318
-
319
-
320
-
321
-
322
-
323
-
324
-
325
-
326
-
327
-
328
-
329
-
330
-
331
-
332
-
333
-
334
-
335
-
336
-
337
-
338
-
339
-
340
-
341
-
342
-
343
-
344
-
345
-
346
-
347
-
348
-
349
-
350
-
351
-
352
-
353
-
354
-
355
-
356
-
357
-
358
-
359
-
360
-
361
-
362
-
363
-
364
-
365
-
366
-
367
-
368
-
369
-
370
-
371
-
372
-
373
-
374
-
375
-
376
-
377
-
378
-
379
-
380
-
381
-
382
-
383
-
384
-
385
-
386
-
387
-
388
-
389
-
390
-
391
-
392
-
393
-
394
-
395
-
396
-
397
-
398
-
399
-
400
-
401
-
402
-
403
-
404
-
405
-
406
-
407
-
408
-
409
-
410
-
411
-
412
-
413
-
414
-
415
-
416
-
417
-
418
-
419
-
420
-
421
-
422
-
423
-
424
-
425
-
426
-
427
-
428
-
429
-
430
-
431
-
432
-
433
-
434
-
435
-
436
-
437
-
438
-
439
-
440
-
441
-
442
-
443
-
444
-
445
-
446
-
447
-
448
-
449
-
450
-
451
-
452
-
453
-
454
-
455
-
456
-
457
-
458
 |
 |

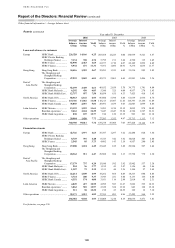
HSBC HOLDINGS PLC
Report of the Directors: Financial Review (continued)
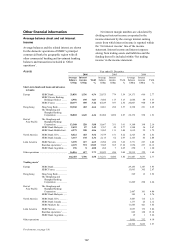
Other financial information > Changes in net interest income
154
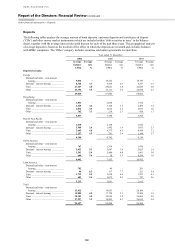
Analysis of changes in net interest income
The following table allocates changes in net interest
income between volume and rate for 2006 compared
with 2005, and for 2005 compared with 2004.
Changes due to a combination of volume and rate,
and the effect of reclassifying items on the adoption
of IAS 32 and IAS 39 at 1 January 2005, are
allocated to rate.
Interest income
2006 compared with 2005
Increase/(decrease)
2005 compared with 2004
Increase/(decrease)
2006 Volume Rate 2005 Volume Rate 2004
US$m US$m US$m US$m US$m US$m US$m
Short-term funds and loans and advances to banks
Europe HSBC Bank .................................
1,536 425 337 774 (64) 169 669
HSBC Private Banking
Holdings (Suisse) .................... 190 42 35 113 32 (8) 89
HSBC France ..............................
690 77 226
387 (339) (234) 960
Hong Kong Hang Seng Bank .......................... 483 82 113
288 (7) 74 221
The Hongkong and Shanghai
Banking Corporation .............. 1,645 54 533 1,058 167 353 538
Rest of
Asia-Pacific
The Hongkong and Shanghai
Banking Corporation .............. 520 52 117 351 54 99 198
HSBC Bank Malaysia ................. 87 20 18 49 11 2 36
HSBC Bank Middle East ............ 208 35 62
111 29 53 29
North America HSBC Bank USA ........................ 465 204 110 151 30 65 56
HSBC Bank Canada .................... 138 31 45 62 (1) 18 45
Latin America HSBC Mexico ............................. 227 31 (32) 228 (47) 48 227
Brazilian operations1 ................... 572 141 (134) 565 164 164 237
HSBC Bank Argentina ................ 8 (2) 3 7 – 4 3
Other operations ........................................................ 627 55 116
456 (76)
203 329
7,396 1,162 1,634 4,600 (5) 968
3,637
Trading assets .......................................................... 3,023
Loans and advances to customers
Europe HSBC Bank .................................
14,166 1,378 565
12,223 1,817 885 9,521
HSBC Private Banking
Holdings (Suisse) .................... 338 49 78
211 27 69 115
HSBC France ..............................
2,463 449 304
1,710 (8) (174) 1,892
HSBC Finance .............................
671 (438) 23
1,086 77 (46) 1,055
Hong Kong Hang Seng Bank .......................... 1,952 61 568
1,323 47 394 882
The Hongkong and Shanghai
Banking Corporation .............. 2,843 156 626
2,061 70 585 1,406
Rest of
Asia-Pacific
The Hongkong and Shanghai
Banking Corporation .............. 3,449 314 476
2,659 478 400 1,781
HSBC Bank Malaysia .................. 430 55 50
325 25 22 278
HSBC Bank Middle East ............ 957 172 150 635 147 70 418
North America HSBC Bank USA ........................ 6,141 114 433
5,594 1,197 1,461 2,936
HSBC Finance .............................
17,061 3,278 476
13,307 439 (278) 13,146
HSBC Bank Canada .................... 2,037 331 267
1,439 286 54 1,099
Latin America HSBC Mexico ............................. 1,532 389 (67) 1,210 205 127 878
Brazilian operations1 ................... 3,244 716 (119) 2,647 879 241 1,527
HSBC Bank Argentina ................ 107 (10) (5) 122 1 20 101
Other operations ........................................................ 1,620 (309) 577
1,352 (266) 505 1,113
59,011 5,756 5,351
47,904 5,230 4,526 38,148
For footnotes, see page 156.