HSBC 2006 Annual Report Download - page 323
Download and view the complete annual report
Please find page 323 of the 2006 HSBC annual report below. You can navigate through the pages in the report by either clicking on the pages listed below, or by using the keyword search tool below to find specific information within the annual report.-
 1
1 -
2
-
3
-
4
-
5
-
6
-
7
-
8
-
9
-
10
-
11
-
12
-
13
-
14
-
15
-
16
-
17
-
18
-
19
-
20
-
21
-
22
-
23
-
24
-
25
-
26
-
27
-
28
-
29
-
30
-
31
-
32
-
33
-
34
-
35
-
36
-
37
-
38
-
39
-
40
-
41
-
42
-
43
-
44
-
45
-
46
-
47
-
48
-
49
-
50
-
51
-
52
-
53
-
54
-
55
-
56
-
57
-
58
-
59
-
60
-
61
-
62
-
63
-
64
-
65
-
66
-
67
-
68
-
69
-
70
-
71
-
72
-
73
-
74
-
75
-
76
-
77
-
78
-
79
-
80
-
81
-
82
-
83
-
84
-
85
-
86
-
87
-
88
-
89
-
90
-
91
-
92
-
93
-
94
-
95
-
96
-
97
-
98
-
99
-
100
-
101
-
102
-
103
-
104
-
105
-
106
-
107
-
108
-
109
-
110
-
111
-
112
-
113
-
114
-
115
-
116
-
117
-
118
-
119
-
120
-
121
-
122
-
123
-
124
-
125
-
126
-
127
-
128
-
129
-
130
-
131
-
132
-
133
-
134
-
135
-
136
-
137
-
138
-
139
-
140
-
141
-
142
-
143
-
144
-
145
-
146
-
147
-
148
-
149
-
150
-
151
-
152
-
153
-
154
-
155
-
156
-
157
-
158
-
159
-
160
-
161
-
162
-
163
-
164
-
165
-
166
-
167
-
168
-
169
-
170
-
171
-
172
-
173
-
174
-
175
-
176
-
177
-
178
-
179
-
180
-
181
-
182
-
183
-
184
-
185
-
186
-
187
-
188
-
189
-
190
-
191
-
192
-
193
-
194
-
195
-
196
-
197
-
198
-
199
-
200
-
201
-
202
-
203
-
204
-
205
-
206
-
207
-
208
-
209
-
210
-
211
-
212
-
213
-
214
-
215
-
216
-
217
-
218
-
219
-
220
-
221
-
222
-
223
-
224
-
225
-
226
-
227
-
228
-
229
-
230
-
231
-
232
-
233
-
234
-
235
-
236
-
237
-
238
-
239
-
240
-
241
-
242
-
243
-
244
-
245
-
246
-
247
-
248
-
249
-
250
-
251
-
252
-
253
-
254
-
255
-
256
-
257
-
258
-
259
-
260
-
261
-
262
-
263
-
264
-
265
-
266
-
267
-
268
-
269
-
270
-
271
-
272
-
273
-
274
-
275
-
276
-
277
-
278
-
279
-
280
-
281
-
282
-
283
-
284
-
285
-
286
-
287
-
288
-
289
-
290
-
291
-
292
-
293
-
294
-
295
-
296
-
297
-
298
-
299
-
300
-
301
-
302
-
303
-
304
-
305
-
306
-
307
-
308
-
309
-
310
-
311
-
312
-
 313
313 -
 314
314 -
 315
315 -
 316
316 -
 317
317 -
 318
318 -
 319
319 -
 320
320 -
 321
321 -
 322
322 -
 323
323 -
 324
324 -
 325
325 -
 326
326 -
 327
327 -
 328
328 -
 329
329 -
 330
330 -
 331
331 -
 332
332 -
 333
333 -
334
-
335
-
336
-
337
-
338
-
339
-
340
-
341
-
342
-
343
-
344
-
345
-
346
-
347
-
348
-
349
-
350
-
351
-
352
-
353
-
354
-
355
-
356
-
357
-
358
-
359
-
360
-
361
-
362
-
363
-
364
-
365
-
366
-
367
-
368
-
369
-
370
-
371
-
372
-
373
-
374
-
375
-
376
-
377
-
378
-
379
-
380
-
381
-
382
-
383
-
384
-
385
-
386
-
387
-
388
-
389
-
390
-
391
-
392
-
393
-
394
-
395
-
396
-
397
-
398
-
399
-
400
-
401
-
402
-
403
-
404
-
405
-
406
-
407
-
408
-
409
-
410
-
411
-
412
-
413
-
414
-
415
-
416
-
417
-
418
-
419
-
420
-
421
-
422
-
423
-
424
-
425
-
426
-
427
-
428
-
429
-
430
-
431
-
432
-
433
-
434
-
435
-
436
-
437
-
438
-
439
-
440
-
441
-
442
-
443
-
444
-
445
-
446
-
447
-
448
-
449
-
450
-
451
-
452
-
453
-
454
-
455
-
456
-
457
-
458
 |
 |

321
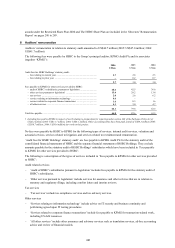
whereby the principal plan is committed to making LIBOR related interest payments in exchange for cash flows paid
into the plan, based on a projection of the future benefit payments from the principal plan. The asset allocation for the
new strategy is:
%
Equities ................................................................................................................................................................................ 12.5
Bonds ................................................................................................................................................................................... 50.0
Alternative assets1 ................................................................................................................................................................ 12.5
Property ................................................................................................................................................................................ 10.0
Cash ..................................................................................................................................................................................... 15.0
100.0
1 Alternative assets include emerging market bonds, loans, and infrastructure assets.
At 31 December 2006, significant progress had been made towards the new strategy and swap arrangements were in
place.
The latest actuarial investigation of the principal plan was made at 31 December 2005, by C G Singer, Fellow of the
Institute of Actuaries, of Watson Wyatt Limited. At that date, the market value of the HSBC Bank (UK) Pension
Scheme’s assets was US$18,072 million (including assets relating to the defined benefit plan, the defined
contribution plan, and additional voluntary contributions). The market value of the plan assets represented 89 per cent
of the amount expected to be required, on the basis of the assumptions adopted, to provide the benefits accrued to
members after allowing for expected future increases in earnings, and the resulting deficit amounted to
US$2,065 million. The method adopted for this investigation was the projected unit method. The expected cash flows
from the plan were projected by reference to the Retail Price Index (‘RPI’) swap break-even curve at 31 December
2005. Salary increases were assumed to be 1 per cent per annum above RPI and inflationary pension increases,
subject to a minimum of 0 per cent and a maximum of 5 per cent, were assumed to be in line with RPI. The projected
cash flows were discounted at the LIBOR swap curve at 31 December 2005 plus a margin for the expected return on
the investment strategy of 110 basis points per annum. The mortality experience of the plan’s pensioners over the
three year period since the previous valuation was analysed and the mortality assumption set on the basis of this with
allowances for medium cohort improvements on the PA92 series of tables from the valuation date.
In anticipation of the results of the 2005 investigation, on 22 December 2005 HSBC Bank plc made an additional
contribution of US$1,746 million to the principal plan in order to reduce the deficit of the plan. Following receipt of
the valuation results, HSBC agreed with the Trustee to meet a schedule of additional future funding payments, as set
out below:
US$m
2007 ..................................................................................................................................................................................... 589
2012 ..................................................................................................................................................................................... 913
2013 ...................................................................................................................................................................................... 913
2014 ...................................................................................................................................................................................... 913
HSBC considers that the contributions set out above are sufficient to meet the deficit as at 31 December 2005 over
the agreed period.
HSBC also decided to make ongoing contributions to the principal plan in respect of the accrual of benefits of
defined benefit section members at the rate of 36 per cent of pensionable salaries from 1 January 2007, until the
completion of the next actuarial valuation, due at 31 December 2008. During 2006 HSBC paid contributions at the
rate of 20 per cent of pensionable salaries. A further 2 per cent of pensionable salaries is being paid over the period
1 January 2007 to 31 December 2014 to make good the difference in contributions during 2006.
As part of the 31 December 2005 valuation, calculations were also carried out as to the amount of assets that might be
needed to meet the liabilities if the plan was discontinued and the members’ benefits bought out with an insurance
company (although in practice this may not be possible for a plan of this size) or the Trustee continued to run the plan
without the support of HSBC. The amount required under this approach is estimated to be US$26,700 million as at 31
December 2005. In estimating the solvency position for this purpose, a more prudent assumption about future
mortality was made than for the assessment of the ongoing position and it was assumed that the Trustee would alter
the investment strategy to be an appropriately matched portfolio of cash and interest and inflation swaps. An explicit
allowance for expenses was also included.