HSBC 2006 Annual Report Download - page 226
Download and view the complete annual report
Please find page 226 of the 2006 HSBC annual report below. You can navigate through the pages in the report by either clicking on the pages listed below, or by using the keyword search tool below to find specific information within the annual report.-
 1
1 -
2
-
3
-
4
-
5
-
6
-
7
-
8
-
9
-
10
-
11
-
12
-
13
-
14
-
15
-
16
-
17
-
18
-
19
-
20
-
21
-
22
-
23
-
24
-
25
-
26
-
27
-
28
-
29
-
30
-
31
-
32
-
33
-
34
-
35
-
36
-
37
-
38
-
39
-
40
-
41
-
42
-
43
-
44
-
45
-
46
-
47
-
48
-
49
-
50
-
51
-
52
-
53
-
54
-
55
-
56
-
57
-
58
-
59
-
60
-
61
-
62
-
63
-
64
-
65
-
66
-
67
-
68
-
69
-
70
-
71
-
72
-
73
-
74
-
75
-
76
-
77
-
78
-
79
-
80
-
81
-
82
-
83
-
84
-
85
-
86
-
87
-
88
-
89
-
90
-
91
-
92
-
93
-
94
-
95
-
96
-
97
-
98
-
99
-
100
-
101
-
102
-
103
-
104
-
105
-
106
-
107
-
108
-
109
-
110
-
111
-
112
-
113
-
114
-
115
-
116
-
117
-
118
-
119
-
120
-
121
-
122
-
123
-
124
-
125
-
126
-
127
-
128
-
129
-
130
-
131
-
132
-
133
-
134
-
135
-
136
-
137
-
138
-
139
-
140
-
141
-
142
-
143
-
144
-
145
-
146
-
147
-
148
-
149
-
150
-
151
-
152
-
153
-
154
-
155
-
156
-
157
-
158
-
159
-
160
-
161
-
162
-
163
-
164
-
165
-
166
-
167
-
168
-
169
-
170
-
171
-
172
-
173
-
174
-
175
-
176
-
177
-
178
-
179
-
180
-
181
-
182
-
183
-
184
-
185
-
186
-
187
-
188
-
189
-
190
-
191
-
192
-
193
-
194
-
195
-
196
-
197
-
198
-
199
-
200
-
201
-
202
-
203
-
204
-
205
-
206
-
207
-
208
-
209
-
210
-
211
-
212
-
213
-
214
-
215
-
 216
216 -
 217
217 -
 218
218 -
 219
219 -
 220
220 -
 221
221 -
 222
222 -
 223
223 -
 224
224 -
 225
225 -
 226
226 -
 227
227 -
 228
228 -
 229
229 -
 230
230 -
 231
231 -
 232
232 -
 233
233 -
 234
234 -
 235
235 -
 236
236 -
237
-
238
-
239
-
240
-
241
-
242
-
243
-
244
-
245
-
246
-
247
-
248
-
249
-
250
-
251
-
252
-
253
-
254
-
255
-
256
-
257
-
258
-
259
-
260
-
261
-
262
-
263
-
264
-
265
-
266
-
267
-
268
-
269
-
270
-
271
-
272
-
273
-
274
-
275
-
276
-
277
-
278
-
279
-
280
-
281
-
282
-
283
-
284
-
285
-
286
-
287
-
288
-
289
-
290
-
291
-
292
-
293
-
294
-
295
-
296
-
297
-
298
-
299
-
300
-
301
-
302
-
303
-
304
-
305
-
306
-
307
-
308
-
309
-
310
-
311
-
312
-
313
-
314
-
315
-
316
-
317
-
318
-
319
-
320
-
321
-
322
-
323
-
324
-
325
-
326
-
327
-
328
-
329
-
330
-
331
-
332
-
333
-
334
-
335
-
336
-
337
-
338
-
339
-
340
-
341
-
342
-
343
-
344
-
345
-
346
-
347
-
348
-
349
-
350
-
351
-
352
-
353
-
354
-
355
-
356
-
357
-
358
-
359
-
360
-
361
-
362
-
363
-
364
-
365
-
366
-
367
-
368
-
369
-
370
-
371
-
372
-
373
-
374
-
375
-
376
-
377
-
378
-
379
-
380
-
381
-
382
-
383
-
384
-
385
-
386
-
387
-
388
-
389
-
390
-
391
-
392
-
393
-
394
-
395
-
396
-
397
-
398
-
399
-
400
-
401
-
402
-
403
-
404
-
405
-
406
-
407
-
408
-
409
-
410
-
411
-
412
-
413
-
414
-
415
-
416
-
417
-
418
-
419
-
420
-
421
-
422
-
423
-
424
-
425
-
426
-
427
-
428
-
429
-
430
-
431
-
432
-
433
-
434
-
435
-
436
-
437
-
438
-
439
-
440
-
441
-
442
-
443
-
444
-
445
-
446
-
447
-
448
-
449
-
450
-
451
-
452
-
453
-
454
-
455
-
456
-
457
-
458
 |
 |

HSBC HOLDINGS PLC
Report of the Directors: The Management of Risk (continued)
Market risk > HSBC Holdings / Residual value risk / Operational risk > Legal litigation risk
224
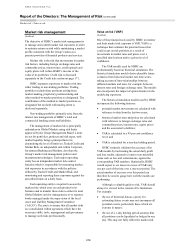
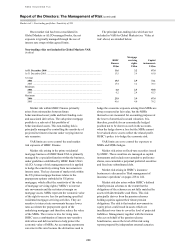
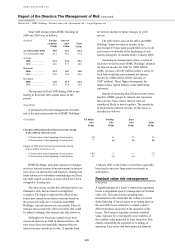
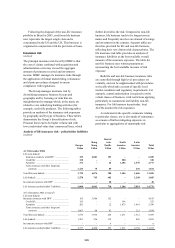
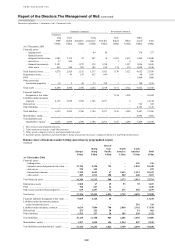
Total VAR arising within HSBC Holdings in
2006 and 2005 was as follows:
(Audited) Foreign
exchange
US$m
Interest
rates
US$m
Total
US$m
At 31 December 2006 30.8 61.4 66.4
At 31 December 2005 26.1 36.1 51.4
Average
2006 ...................... 27.4 43.6 49.2
2005 ...................... 24.0 33.7 48.9
Minimum
2006 ...................... 23.2 30.7 34.8
2005 ...................... 22.0 29.6 42.6
Maximum
2006 ...................... 32.0 61.4 66.4
2005 ...................... 26.1 45.9 56.6
The increase in Total VAR during 2006 is due
mainly to fixed rate debt capital issues in the
period.
(Unaudited)
A principal tool in the management of market
risk is the projected sensitivity of HSBC Holdings’
net interest income to future changes in yield
curves.
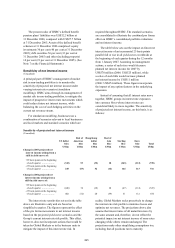
The table below sets out the effect on HSBC
Holdings’ future net interest income of an
incremental 25 basis point parallel fall or rise in all
yield curves worldwide at the beginning of each
quarter during the 12 months from 1 January 2006.
Assuming no management action, a series of
such rises would increase HSBC Holdings’ planned
net interest income for 2007 by US$8 million
(2006: decrease of US$7 million) while a series of
such falls would decrease planned net interest
income by US$8 million (2006: increase of
US$7 million). These figures incorporate the
impact of any option features in the underlying
exposures.
Instead of assuming that all interest rates move
together, HSBC groups its interest rate exposures
into currency blocs whose interest rates are
considered likely to move together. The sensitivity
of projected net interest income, on this basis, is
described as follows:
(Unaudited) US dollar
bloc
Sterling
bloc
Euro
bloc
Total
US$m US$m US$m US$m
Change in 2007 projected net interest income arising
from a shift in yield curves of:
+ 25 basis points at the beginning of each quarter .. (7) 6 9 8
– 25 basis points at the beginning of each quarter .. 7 (6) (9) (8)
Change in 2006 projected net interest income arising
from a shift in yield curves of:
+ 25 basis points at the beginning of each quarter... (18) 5 6 (7)
– 25 basis points at the beginning of each quarter... 18 (5) (6) 7
HSBC Holdings’ principal exposure to changes
in its net interest income from movements in interest
rates arises on short-term cash balances, floating rate
loans advanced to subsidiary undertakings and fixed
rate debt capital securities in issue which have been
swapped to floating rate.
The interest rate sensitivities tabulated above are
illustrative only and are based on simplified
scenarios. The figures represent the effect of pro
forma movements in net interest income based on
the projected yield curve scenarios and HSBC
Holdings’ current interest rate risk profile. They do
not take into account the effect of actions that could
be taken to mitigate this interest rate risk, however.
Although new fixed rate capital issues have
caused an increase in VAR as disclosed above, the
new issues have not materially impacted the net
interest income sensitivity for the 12 months from
1 January 2007 as the funds received have generally
been used to increase long-term investments in
subsidiaries.
Residual value risk management
(Unaudited)
A significant part of a lessor’s return from operating
leases is dependent upon its management of residual
value risk. This arises from operating lease
transactions to the extent that the values recovered
from disposing of leased assets or re-letting them at
the end of the lease terms (the ‘residual values’)
differ from those projected at the inception of the
leases. The business regularly monitors residual
value exposure by reviewing the recoverability of
the residual value projected at lease inception. This
entails considering the potential of re-letting of
operating lease assets and their projected disposal