HSBC 2006 Annual Report Download - page 364
Download and view the complete annual report
Please find page 364 of the 2006 HSBC annual report below. You can navigate through the pages in the report by either clicking on the pages listed below, or by using the keyword search tool below to find specific information within the annual report.-
 1
1 -
2
-
3
-
4
-
5
-
6
-
7
-
8
-
9
-
10
-
11
-
12
-
13
-
14
-
15
-
16
-
17
-
18
-
19
-
20
-
21
-
22
-
23
-
24
-
25
-
26
-
27
-
28
-
29
-
30
-
31
-
32
-
33
-
34
-
35
-
36
-
37
-
38
-
39
-
40
-
41
-
42
-
43
-
44
-
45
-
46
-
47
-
48
-
49
-
50
-
51
-
52
-
53
-
54
-
55
-
56
-
57
-
58
-
59
-
60
-
61
-
62
-
63
-
64
-
65
-
66
-
67
-
68
-
69
-
70
-
71
-
72
-
73
-
74
-
75
-
76
-
77
-
78
-
79
-
80
-
81
-
82
-
83
-
84
-
85
-
86
-
87
-
88
-
89
-
90
-
91
-
92
-
93
-
94
-
95
-
96
-
97
-
98
-
99
-
100
-
101
-
102
-
103
-
104
-
105
-
106
-
107
-
108
-
109
-
110
-
111
-
112
-
113
-
114
-
115
-
116
-
117
-
118
-
119
-
120
-
121
-
122
-
123
-
124
-
125
-
126
-
127
-
128
-
129
-
130
-
131
-
132
-
133
-
134
-
135
-
136
-
137
-
138
-
139
-
140
-
141
-
142
-
143
-
144
-
145
-
146
-
147
-
148
-
149
-
150
-
151
-
152
-
153
-
154
-
155
-
156
-
157
-
158
-
159
-
160
-
161
-
162
-
163
-
164
-
165
-
166
-
167
-
168
-
169
-
170
-
171
-
172
-
173
-
174
-
175
-
176
-
177
-
178
-
179
-
180
-
181
-
182
-
183
-
184
-
185
-
186
-
187
-
188
-
189
-
190
-
191
-
192
-
193
-
194
-
195
-
196
-
197
-
198
-
199
-
200
-
201
-
202
-
203
-
204
-
205
-
206
-
207
-
208
-
209
-
210
-
211
-
212
-
213
-
214
-
215
-
216
-
217
-
218
-
219
-
220
-
221
-
222
-
223
-
224
-
225
-
226
-
227
-
228
-
229
-
230
-
231
-
232
-
233
-
234
-
235
-
236
-
237
-
238
-
239
-
240
-
241
-
242
-
243
-
244
-
245
-
246
-
247
-
248
-
249
-
250
-
251
-
252
-
253
-
254
-
255
-
256
-
257
-
258
-
259
-
260
-
261
-
262
-
263
-
264
-
265
-
266
-
267
-
268
-
269
-
270
-
271
-
272
-
273
-
274
-
275
-
276
-
277
-
278
-
279
-
280
-
281
-
282
-
283
-
284
-
285
-
286
-
287
-
288
-
289
-
290
-
291
-
292
-
293
-
294
-
295
-
296
-
297
-
298
-
299
-
300
-
301
-
302
-
303
-
304
-
305
-
306
-
307
-
308
-
309
-
310
-
311
-
312
-
313
-
314
-
315
-
316
-
317
-
318
-
319
-
320
-
321
-
322
-
323
-
324
-
325
-
326
-
327
-
328
-
329
-
330
-
331
-
332
-
333
-
334
-
335
-
336
-
337
-
338
-
339
-
340
-
341
-
342
-
343
-
344
-
345
-
346
-
347
-
348
-
349
-
350
-
351
-
352
-
353
-
 354
354 -
 355
355 -
 356
356 -
 357
357 -
 358
358 -
 359
359 -
 360
360 -
 361
361 -
 362
362 -
 363
363 -
 364
364 -
 365
365 -
 366
366 -
 367
367 -
 368
368 -
 369
369 -
 370
370 -
 371
371 -
 372
372 -
 373
373 -
 374
374 -
375
-
376
-
377
-
378
-
379
-
380
-
381
-
382
-
383
-
384
-
385
-
386
-
387
-
388
-
389
-
390
-
391
-
392
-
393
-
394
-
395
-
396
-
397
-
398
-
399
-
400
-
401
-
402
-
403
-
404
-
405
-
406
-
407
-
408
-
409
-
410
-
411
-
412
-
413
-
414
-
415
-
416
-
417
-
418
-
419
-
420
-
421
-
422
-
423
-
424
-
425
-
426
-
427
-
428
-
429
-
430
-
431
-
432
-
433
-
434
-
435
-
436
-
437
-
438
-
439
-
440
-
441
-
442
-
443
-
444
-
445
-
446
-
447
-
448
-
449
-
450
-
451
-
452
-
453
-
454
-
455
-
456
-
457
-
458
 |
 |

HSBC HOLDINGS PLC
Notes on the Financial Statements (continued)
Notes 20 and 21
362
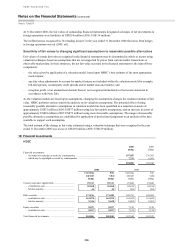
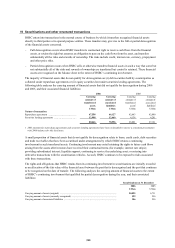
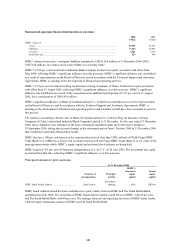
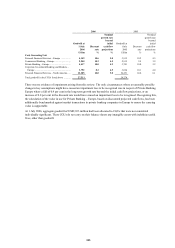
Summarised aggregate financial information on joint ventures
2006 2005
US$m US$m
HSBC’s share of:
– current assets .............................................................................................................................. 125 95
– non-current assets ....................................................................................................................... 107 55
– current liabilities ......................................................................................................................... 98 34
– non-current liabilities ................................................................................................................. 87 107
– income ........................................................................................................................................ 102 118
– expenses ...................................................................................................................................... 79 20
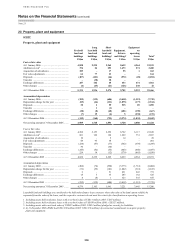
21 Goodwill and intangible assets
Goodwill and intangible assets includes goodwill arising on business combinations, the present value of in-force
long-term insurance business, and other intangible assets.
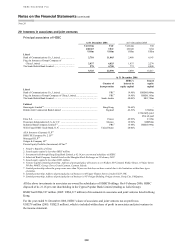
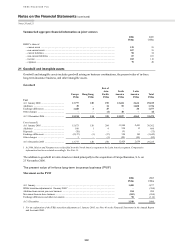
Goodwill
Europe Hong Kong
Rest of
Asia-
Pacific
North
America
Latin
America Total
US$m US$m US$m US$m US$m US$m
Cost
At 1 January 2006 ....................................... 13,777 120 270 12,424 2,634 29,225
Additions .................................................... 29 – 34 55 1,608 1,726
Exchange differences .................................. 1,428 4 25 – 20 1,477
Other changes ............................................. – – (4) 48 – 44
At 31 December 2006 ................................. 15,234 124 325 12,527 4,262 32,472
Cost (restated1)
At 1 January 2005 ....................................... 15,873 120 284
11,594 2,491 30,362
Additions .................................................... 108 1 4
534 13 660
Disposals ..................................................... (70) – – (3)
–
(73)
Exchange differences .................................. (2,137) (1) (17) 328 185 (1,642)
Other changes ............................................. 3 – (1) (29) (55) (82)
At 31 December 2005 ................................. 13,777 120 270
12,424 2,634 29,225
1 In 2006, Mexico and Panama were reclassified from the North America segment to the Latin America segment. Comparative
information has been restated accordingly. See Note 13.
The addition to goodwill in Latin America related principally to the acquisition of Grupo Banistmo, S.A. on
23 November 2006.
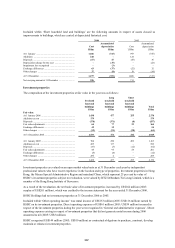
The present value of in-force long-term insurance business (‘PVIF’)
Movement on the PVIF
2006 2005
US$m US$m
At 1 January ....................................................................................................................................... 1,400 1,877
IFRSs transition adjustment at 1 January 20051 ................................................................................ – (384)
Addition from current year new business ......................................................................................... 254 289
Movement from in-force business ..................................................................................................... (203) (268)
Exchange differences and other movements ..................................................................................... 98 (114)
At 31 December ................................................................................................................................. 1,549 1,400
1 For an explanation of the IFRSs transition adjustment at 1 January 2005, see Note 46 on the Financial Statements in the Annual Report
and Accounts 2005.