Humana 2007 Annual Report Download - page 102
Download and view the complete annual report
Please find page 102 of the 2007 Humana annual report below. You can navigate through the pages in the report by either clicking on the pages listed below, or by using the keyword search tool below to find specific information within the annual report.-
 1
1 -
2
-
3
-
4
-
5
-
6
-
7
-
8
-
9
-
10
-
11
-
12
-
13
-
14
-
15
-
16
-
17
-
18
-
19
-
20
-
21
-
22
-
23
-
24
-
25
-
26
-
27
-
28
-
29
-
30
-
31
-
32
-
33
-
34
-
35
-
36
-
37
-
38
-
39
-
40
-
41
-
42
-
43
-
44
-
45
-
46
-
47
-
48
-
49
-
50
-
51
-
52
-
53
-
54
-
55
-
56
-
57
-
58
-
59
-
60
-
61
-
62
-
63
-
64
-
65
-
66
-
67
-
68
-
69
-
70
-
71
-
72
-
73
-
74
-
75
-
76
-
77
-
78
-
79
-
80
-
81
-
82
-
83
-
84
-
85
-
86
-
87
-
88
-
89
-
90
-
91
-
 92
92 -
 93
93 -
 94
94 -
 95
95 -
 96
96 -
 97
97 -
 98
98 -
 99
99 -
 100
100 -
 101
101 -
 102
102 -
 103
103 -
 104
104 -
 105
105 -
 106
106 -
 107
107 -
 108
108 -
 109
109 -
 110
110 -
 111
111 -
 112
112 -
113
-
114
-
115
-
116
-
117
-
118
-
119
-
120
-
121
-
122
-
123
-
124
-
125
 |
 |

Humana Inc.
NOTES TO CONSOLIDATED FINANCIAL STATEMENTS—(Continued)
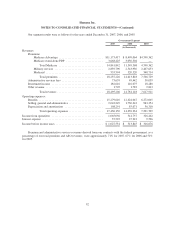
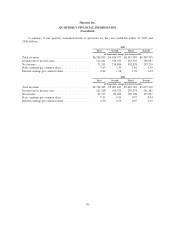
Our segment results were as follows for the years ended December 31, 2007, 2006, and 2005:
Government Segment
2007 2006 2005
(in thousands)
Revenues:
Premiums:
Medicare Advantage ............................... $11,173,417 $ 8,499,064 $4,590,362
Medicare stand-alone PDP .......................... 3,668,425 3,050,304 —
Total Medicare ............................... 14,841,842 11,549,368 4,590,362
Military services .................................. 2,839,790 2,543,930 2,407,653
Medicaid ........................................ 555,594 520,520 548,714
Total premiums ............................... 18,237,226 14,613,818 7,546,729
Administrative services fees ............................. 73,659 49,442 50,059
Investment income .................................... 182,616 116,075 18,280
Other revenue ........................................ 1,705 1,783 2,843
Total revenues ................................ 18,495,206 14,781,118 7,617,911
Operating expenses:
Benefits ............................................. 15,279,610 12,424,047 6,272,045
Selling, general and administrative ........................ 2,042,249 1,730,243 963,354
Depreciation and amortization ........................... 108,291 85,071 56,310
Total operating expenses ........................ 17,430,150 14,239,361 7,291,709
Income from operations .................................... 1,065,056 541,757 326,202
Interest expense ........................................... 37,525 27,912 9,526
Income before income taxes ................................. $ 1,027,531 $ 513,845 $ 316,676
Premium and administrative services revenues derived from our contracts with the federal government, as a
percentage of our total premium and ASO revenues, were approximately 71% for 2007, 67% for 2006 and 51%
for 2005.
92